We Discuss Two Companies That Recently Posted 52-Week Highs, Plus Updated Price Targets
Companies With New 52-Week Highs
Let’s take a closer look at each company.
Williams-Sonoma (WSM)

Analyst Price Target: $247.11
How are investors assessing Williams-Sonoma?
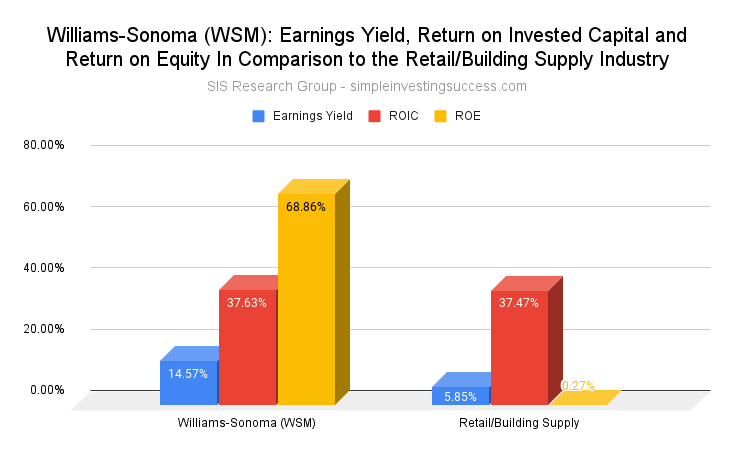
The current earnings yield for Williams-Sonoma is 14.57%, 8.72% higher than the Retail/Building Supply Industry yield of 5.85%. Williams-Sonoma reported a return on invested capital (ROIC) of 37.63% in comparison to the Retail/Building Supply Industry ROIC of 37.47%. Additionally, Williams-Sonoma has a return on equity (ROE) of 68.86%, compared to the Retail/Building Supply Industry ROE of 0.27%.

How has WSM stock performed over the past year? What is the current analyst price target for WSM stock?
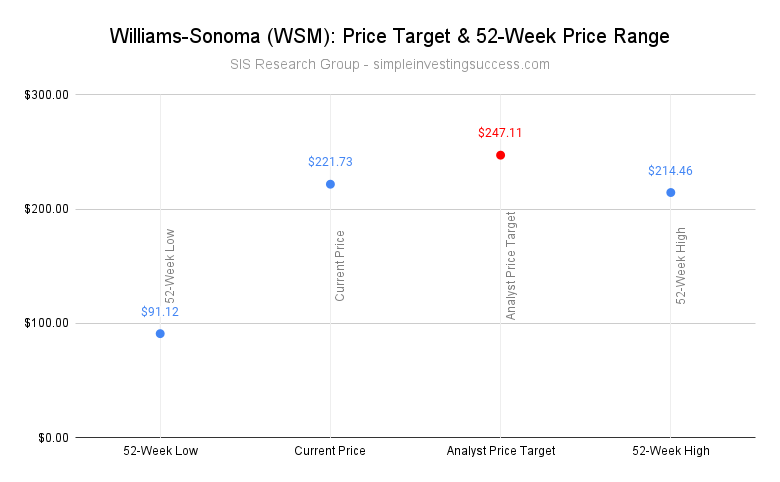
Over the past 52 weeks, Williams-Sonoma has traded between the range of $91.12 and $214.46.
The current Analyst Price Target for Williams-Sonoma is $247.11.

What type of business does Williams-Sonoma engage in?
Williams-Sonoma operates as an omni-channel specialty retailer of various products for home. It offers cooking, dining, and entertaining products, such as cookware, tools, electrics and furniture. The company markets its products through e-comm websites, direct-mail catalogs and retail stores. As of January 2021, it operated 581 stores (538 stores in 42 states, Washington, D.C., and Puerto Rico; 21 stores in Canada; 19 stores in Australia; 3 stores in the United Kingdom; and 136 franchised stores, as well as e-commerce websites in various countries in the Middle East, the Philippines, Mexico, and South Korea). Williams-Sonoma, Inc. was founded in 1956 and is headquartered in San Francisco, California. The current CEO is Laura Alber.
Williams-Sonoma is a Large Cap company with a market cap of $15.4B. The YTD performance for WSM stock is 108.17%.
Best Buy (BBY)

Analyst Price Target: $152.83
How are investors assessing Best Buy?
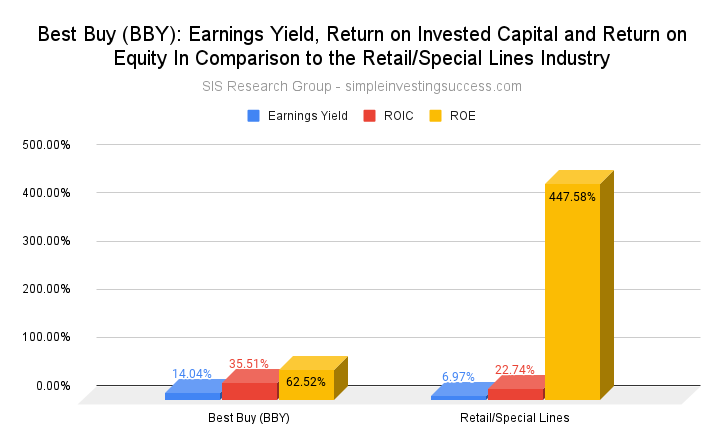
The current earnings yield for Best Buy is 14.04%, 7.07% higher than the Retail/Special Lines Industry yield of 6.97%. Best Buy reported a return on invested capital (ROIC) of 35.51% in comparison to the Retail/Special Lines Industry ROIC of 22.74%. Additionally, Best Buy has a return on equity (ROE) of 62.52%, compared to the Retail/Special Lines Industry ROE of 447.58% (Note: The ROE is based on the TTM ROE for the Special Lines Industry. In January 2021, the ROE for the industry was -0.64%).

How has BBY stock performed over the past year? What is the current analyst price target?
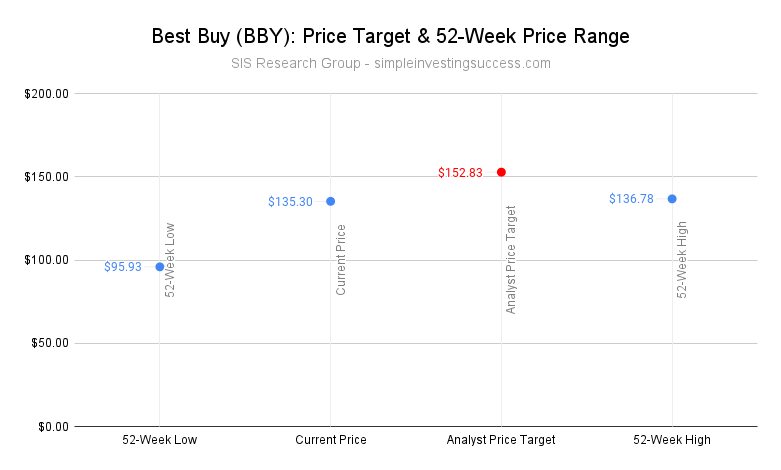
Over the past 52 weeks, Best Buy has traded between the range of $95.93 and $136.78.
The current Analyst Price Target for Best Buy is $152.83.

What type of business does Best Buy engage in?
Best Buy is a technology product retailer in the US and Canada. The company offers its products through stores and websites under the following brands: BestBuy, Best Buy Business, Best Buy Express, Best Buy Health, CST, Geek Squad, GreatCall, Lively, Magnolia, Pacific Kitchen, and Home, as well as the domain names bestbuy.com and greatcall.com.
As of January 2021, it had 1,126 large-format and 33 small-format stores. The company was formerly known as Sound of Music. Best Buy was incorporated in 1966 and is headquartered in Richfield, Minnesota. The current CEO is Corie Barry.
Best Buy is a Large Cap company with a market cap of $31.9B. The YTD performance for BBY is 32.64%.
We hope you enjoyed this list of stocks investors are buying that recently posted 52-Week Lows. Be sure to add WSM stock and BBY stock to your Watch List and if you haven’t done so already, check in on the performance of our Current Portfolio. Keep it simple and always do your due diligence with WSM stock and BBY stock assessments.
All companies were identified using SIS Research Group valuation methodology, which seeks out undervalued companies, using simple quantitative metrics. Many of the companies that SIS Research Group issues valuations for can be viewed in our public case study (access here) which tracks a portfolio of primarily micro and small cap companies on a quarterly basis. Additionally, companies meeting discount criteria can also be found in the SIS Research Group public database, which is updated quarterly (access here).
This material is provided for informational purposes only and is not financial advice. The information contained herein should not solely be used for the formation of an investment decision, whether you are a long term or short term investor.