Bioventus Inc. (BVS): A Comprehensive Analysis of Earnings Yield, P/E, ROI and YTD Performance Against the Healthcare Products and S&P 500
In this article, we’ll provide an in-depth analysis of Bioventus (BVS), including an updated stock price target and key financial metrics such as earnings yield, price-to-earnings ratio, return on invested capital and year-to-date performance. Our comprehensive stock rating will help investors make informed decisions about Bioventus’s potential as a near-term and long-term investment. Bioventus is a Micro Cap company with a Market Cap of $76.3M.
Stock Price Target: $4.38
Bioventus Inc. Background
Bioventus Inc. is a medical device company that develops and sells products to enhance the body’s natural healing process. They offer pain treatments, surgical solutions, and restorative therapies to physicians in various orthopedic fields. Their products are used in clinics, hospitals, and surgical centers. One of the company’s key foci is to provide innovative and effective pain treatments to patients. Bioventus offers a range of non-surgical joint pain injection therapies, as well as peripheral nerve stimulation products that help alleviate chronic pain. These treatments have proven to be highly effective and have received widespread recognition from physicians and patients alike.
Founded in 2011, Bioventus is headquartered in Durham, North Carolina.
What’s the Significance of Bioventus Earnings Yield For Investors Assessing the Company?
Earnings Yield: An Essential Metric for Investors to Evaluate A Companies’ Relative Value
At SCRG, we utilize an adjusted earning yield calculation that captures variations amongst companies, such as debt and tax rates, rather than relying on the inverse P/E ratio. By using this method, we can better determine if a company is underpriced or overpriced relative to other variables like sector, industry, or bond yields.
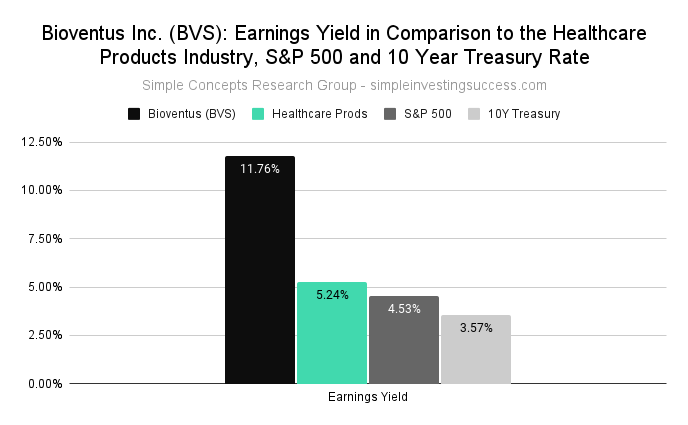
Bioventus Inc.’s current earnings yield stands at 11.76%, compared to 4.53% for the S&P 500 and 3.57% for the 10-year treasury bond. The median earnings yield for the Healthcare Products industry is 5.24%.
Bioventus’s Price-to-Earnings Ratio (P/E): What It Reveals to Investors About the Company?
Understanding Bioventus’ Price-to-Earnings Ratio (P/E) and Its Significance for Investors
P/E ratio is a commonly used metric to assess a company’s stock valuation relative to other companies and the market. By comparing a company’s past or future earnings to its current market price, investors can evaluate if a stock is currently overvalued or undervalued. A high P/E ratio could indicate an overvalued stock, while a low P/E ratio could suggest an undervalued stock.
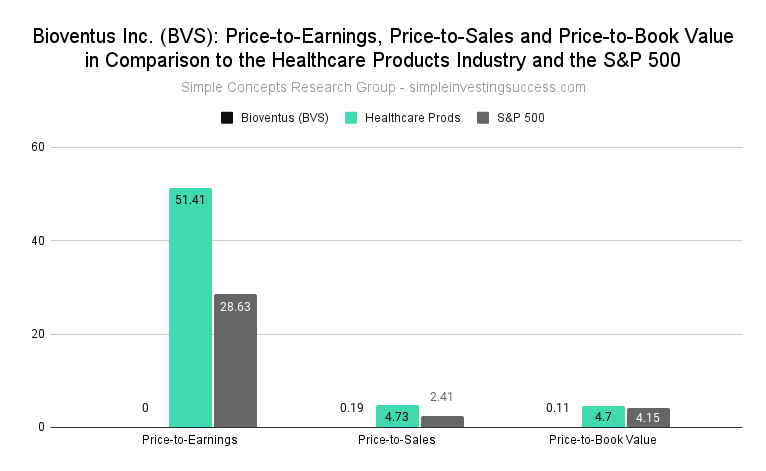
Currently, Bioventus Inc. P/E ratio is unavailable; the Healthcare Products industry P/E ratio of 51.41 and the S&P 500’s P/E ratio of 28.63.
What’s Bioventus’ Current Price-to-Sales Ratio (P/S)?
Understanding Bioventus’ Price-to-Sales Ratio (P/S) and Its Role in Valuation
(P/S) ratio is a metric that uses a company’s market capitalization and revenue to determine its value. It’s calculated by dividing a company’s market cap by its total sales or revenue. The P/S ratio offers insight into how much the market values each dollar of a company’s sales, making it useful for evaluating unprofitable growth stocks or companies facing unique challenges. A lower P/S ratio may indicate better value.
Currently, Bioventus Inc. has a P/S ratio of 0.19, compared to the Healthcare Products industry P/S ratio of 4.73 and the S&P 500’s P/S ratio of 2.41.
How does Bioventus Price-to-BookRatio (P/B) Compare to the Healthcare Products industry?
P/B is the ratio of a company’s market value to its book value of equity (the value of assets on its books). It’s a key metric used by investors to determine if a stock is fairly valued. A P/B of 1 indicates the stock is trading in line with its book value. A high P/B ratio could indicate the stock is overvalued, while a low P/B ratio could mean the stock is undervalued.
Bioventus Inc. has a P/B ratio of 0.11, while the Healthcare Products industry’s P/B is 4.7 and the S&P 500’s P/B ratio is 4.15.
How does Bioventus Return on Invested Capital (ROIC) Compare to Industry Standards (& What Does This Mean for Investors?)
Investors use Return on Invested Capital (ROIC) to measure a company’s efficiency in generating profits from capital. ROIC is the amount of money a company earns from investments above the average cost of debt and equity. ROIC can provide context for metrics like the Price-to-Earnings (P/E) ratio, as a low P/E ratio could indicate that a company is oversold, but it could also mean that a company is no longer generating value for shareholders. Companies with consistently high ROIC may trade at a premium compared to other stocks, even if their P/E ratios are high.
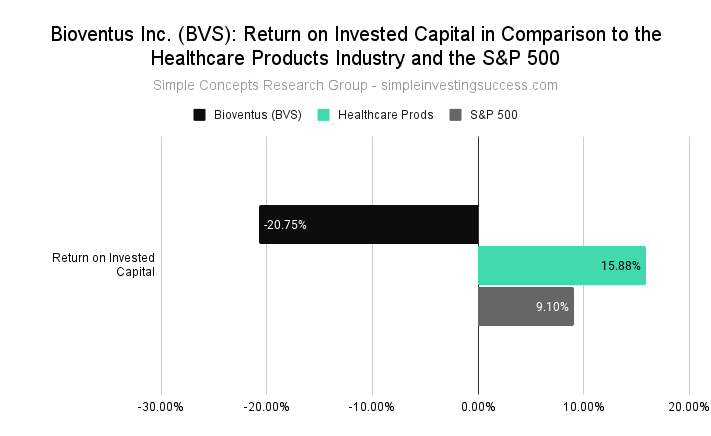
How attractive is Bioventus Inc.’s ROIC to investors? Bioventus Inc. has an ROIC of -20.75%, while the Healthcare Products has 15.88% and the S&P 500 has 9.1%.
What Has Been the Performance of BVS Stock Over the Past Year? What Is the Current Analyst Price Target?
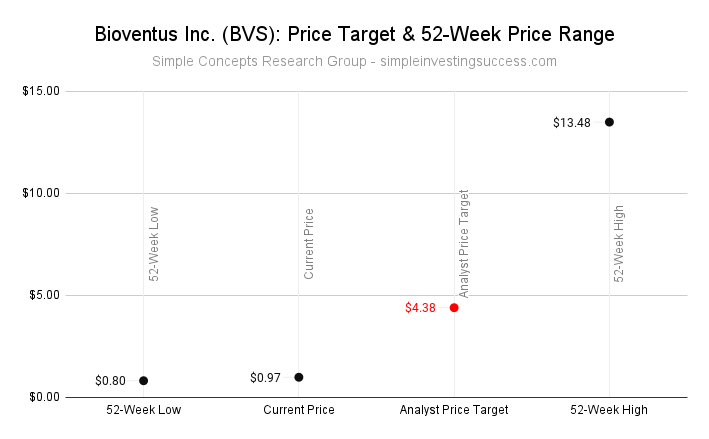
Bioventus stock has traded between $0.80 and $13.48 over the past 52 weeks.
The current Analyst Price Target for Bioventus Inc. is $4.38.
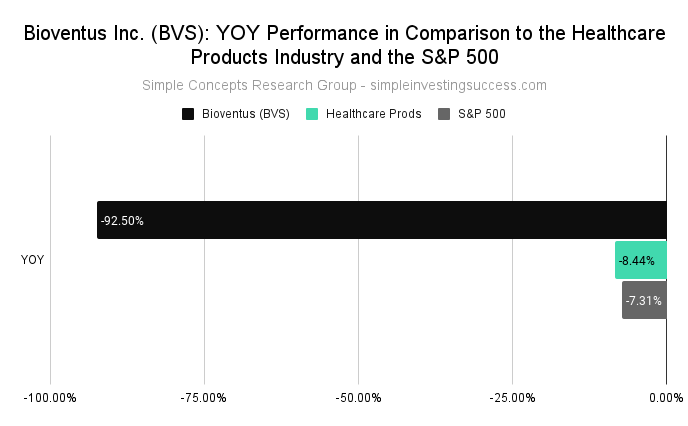
How Does Bioventus’ Year-Over-Year (YOY) Performance Compare to Its Industry and the Overall Market?
Bioventus has a YOY performance of -92.5%, while the Healthcare Products industry has a YOY performance of -8.44% compared to the YOY S&P 500 performance of -7.31%.
Stock Price Target: $4.38
Recent Financial Results (Q4, 2022)
- Bioventus reported a decrease in net sales of $4.6 million year-over-year, with net sales of $125.8 million. The decrease was attributed to lower organic sales and currency headwinds.
- The company reported a net loss of $44.9 million compared to a net loss of $1.9 million in the prior year, and adjusted EBITDA of $15.2 million compared to $28.5 million in the prior year. The loss per share of Class A common stock was $0.52 compared to $0.01 in the prior year, and the non-GAAP loss per share was $0.06 compared to non-GAAP earnings per share of $0.26 in the prior year.
Be sure to add Bioventus (BVS) to your Watch List. Keep it simple and always do your due diligence.
Please note that the information provided in this material is intended for informational purposes only and should not be construed as financial advice. The contents of this material are not intended to serve as a recommendation or endorsement to buy or sell any financial product or instrument, nor should it be solely relied upon in making investment decisions, whether you are a long-term or short-term investor. Please consult with a qualified financial advisor or professional before making any investment decisions.