The ODP Corporation (ODP) Company Overview & Stock Price Forecast
This article provides a brief analysis and stock rating for The ODP Corporation (ODP) including an updated stock price target. Additional data on the company’s earnings yield, price/earnings ratio, return on invested capital and YTD performance are discussed as well.

The ODP Corp Fundamentals
Stock Price Target: $61.27
In the section below, we discuss the earnings yield, P/E, return on invested capital and YTD performance for The ODP Corp in comparison to the Specialty Retail industry and the S&P 500.
The ODP Corporation is a Small Cap company with a Market Cap of $2.36B.
How are investors using The ODP Corp earnings yield to assess the company?
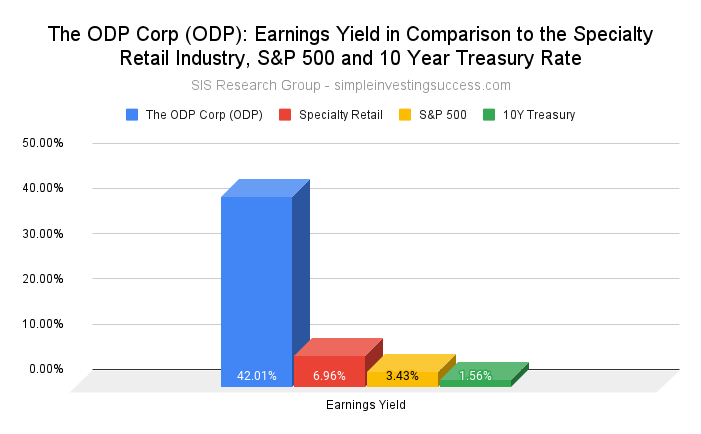
The earnings yield is used to show the percentage of a company’s earnings per share. Investors typically use earnings yield to determine which assets are underpriced or overpriced relative to other variables, like sector, industry or bond yields. Simply put, the earnings yield of a company can be used to assess how expensive a company is in relation to the earnings that are generated. When valuing companies, the SIS Research Group does not utilize the inverse P/E ratio to calculate the earnings yield. Instead, we use an adjusted earning yield calculation to capture variation amongst companies (i.e. debt and tax rates).
The current earnings yield for The ODP Corp is 42.01%%, in comparison to 3.43% for the S&P 500 and 1.56% for the 10-year treasury bond. The median earnings yield for the Specialty Retail industry is 6.96%.
What does The ODP Corp Price-to-Earnings Ratio (P/E) tell investors about the company?
The price-to-earnings ratio (P/E) is a relatively popular metric used by investors and analysts for valuing a company’s stock. The P/E ratio can be used to show how a stock’s valuation compares to other companies and the total market. Investors use the P/E ratio to determine what the market is willing to pay today based on a company’s past or future earnings. A high P/E ratio could mean that a stock’s price is too high relative to earnings, which could be a signal that a stock is currently overvalued. In turn, a low P/E ratio could indicate that a company’s current stock price is low relative to earnings.
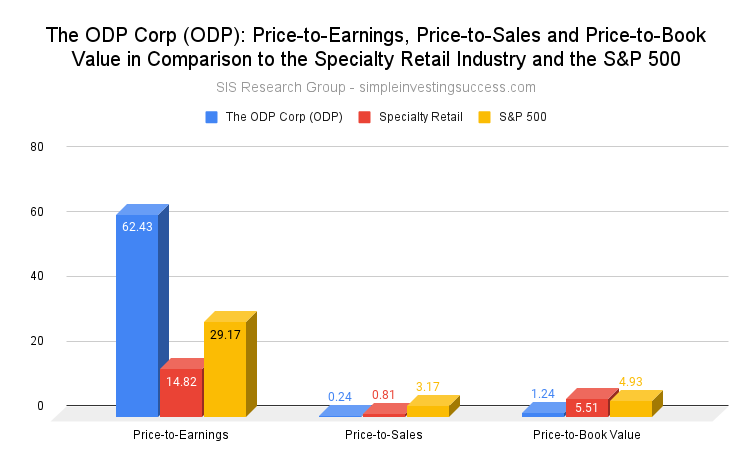
The ODP Corp is currently trading at a P/E of 62.43. The P/E for the Specialty Retail industry is 14.82 and the P/E for the S&P 500 is 29.17.
What is the current Price-to-Sales Ratio (P/S) for The ODP Corp?
The Price-to-Sales Ratio (P/S) looks at a company’s market cap and revenue to determine valuation. The P/S ratio is calculated by taking a company’s market cap and dividing by the total sales or revenue. The P/S ratio gives an idea of how much the market values every dollar of a company’s sales and can be effective in valuing unprofitable growth stocks or companies that are currently undergoing special situations or challenges. A lower the P/S ratio can be an indicator of good value.
The ODP Corp is currently trading at a P/S of 0.24. The P/S for the Specialty Retail industry is 0.81 and the P/S for the S&P 500 is 3.17.
How does The ODP Corp Price-to-BookRatio (P/B) compare to the Specialty Retail industry?
Price-to-book value (P/B) is the ratio of the market value of a company’s shares divided by its book value of equity (the value of it’s assets on the books). The book value is the difference between the book value of assets and liabilities. Typically, investors use the P/B ratio to assess if a stock is valued properly (a value of one means that the stock price is trading in line with the book value of the company). A company with a high P/B ratio could mean the stock price is overvalued as well as the converse.
The ODP Corp P/B ratio is 1.24. The P/B for the Specialty Retail industry is 5.51 and the P/B for the S&P 500 is 4.93.
How attractive is The ODP Corp‘s Return on Invested Capital (ROIC) to investors?
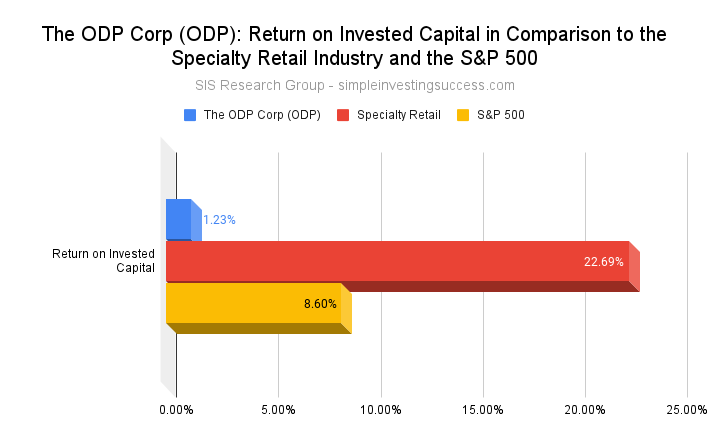
Investors use the return on invested capital (ROIC) to assess how efficient a company is at turning capital into profits. The ROIC is the amount of money a company makes on it’s investments that is above the average cost of debt and equity.
Investors can use the ROIC to provide context for metrics like the (P/E) ratio. For instance, when used in isolation a low P/E ratio could suggest a company is oversold but the decline could be because a company is no longer generating value for shareholders. Conversely, companies that consistently generate high rates of ROIC can plausibly trade at a premium compared to other stocks, even if their P/E ratios are high.
The ODP Corp ROIC is currently 1.23% in comparison to 22.69% for the Specialty Retail industry and 8.60% for the S&P 500.
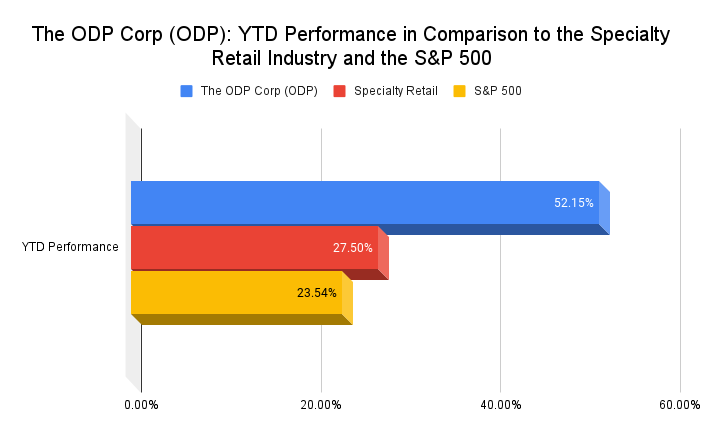
What is The ODP Corp YTD Performance in comparison to its industry and the total market?
The year-to-date (YTD) performance is the amount of profit/loss realized by a stock since the first trading day of the current calendar year.
The YTD performance for The ODP Corp is 52.15%. The Specialty Retail industry has a YTD performance of 27.50% in comparison to the YTD S&P 500 performance of 23.54%.
Recent Financial Results
- Total sales of $2.2B, down 7% YoY, driven by 160 fewer retail locations in service
- GAAP operating income of $104M and net income $73M, or $1.33 per diluted share, versus $102M and $34M YoY
- Adjusted operating income of $122M, compared to $136M in the third quarter of 2020
- Operating cash flow $121M
- Adjusted free cash flow of $123M, in comparison to $259M YoY
- $1.7B of total liquidity including $753M in cash and cash equivalents
Stock Price Target: $61.27
Company Overview
The ODP Corporation provides business services and supplies, products, and digital workplace tech solutions for small, medium, and enterprise businesses. The company operates in three divisions: Business Solutions, Retail, and CompuCom.
The Business Solutions division offers office supply products and services, technology services, copy and print services, and office furniture products and services through sales forces and Internet Websites in the US, Puerto Rico, the U.S. Virgin Islands, and Canada.
The Retail division operates a chain of retail stores. As of February 2021, the company operated 1,154 retail stores.
The CompuCom division offers technology services supporting the technology needs of enterprise organizations in the US and Canada. It offers a range of solutions, including technology lifecycle management, end user computing and collaboration and IT workforce solutions. The company offers its products under various brands, including Office Depot, OfficeMax, CompuCom, Grand&Toy, as well as others.
The ODP Corporation was incorporated in 1986 and is based in Boca Raton, Florida. The current CEO is Gerry P. Smith.
Be sure to add The ODP Corp (ODP) to your Watch List and if you haven’t done so already, check in on the performance of our Current Portfolio. Keep it simple and always do your due diligence.
This material is provided for informational purposes only and is not financial advice. The information contained herein should not solely be used for the formation of an investment decision, whether you are a long term or short term investor.