
Winnebago (WGO) Company Overview & Stock Price Forecast
This article provides a brief analysis and stock rating for Winnebago (WGO) including an updated stock price target. Additional data on the company’s earnings yield, price/earnings ratio, return on invested capital and YTD performance are discussed as well.

Winnebago Fundamentals
WGO Stock Price Target: $87.61
In the section below, we discuss the earnings yield, P/E, return on invested capital and YTD performance for Winnebago in comparison to the Auto/Truck industry and the S&P 500.
Winnebago is a Small Cap company with a Market Cap of $2.35B.
How are investors using Winnebago earnings yield to assess the company?
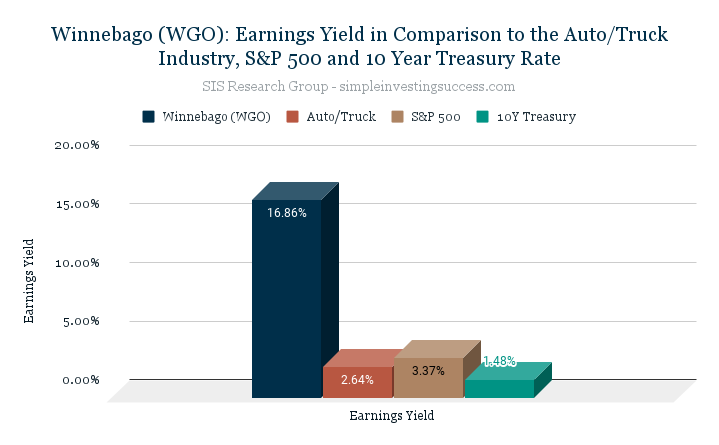
The earnings yield is used to show the percentage of a company’s earnings per share. Investors typically use earnings yield to determine which assets are underpriced or overpriced relative to other variables, like sector, industry or bond yields. Simply put, the earnings yield of a company can be used to assess how expensive a company is in relation to the earnings that are generated. When valuing companies, the SIS Research Group does not utilize the inverse P/E ratio to calculate the earnings yield. Instead, we use an adjusted earning yield calculation to capture variation amongst companies (i.e. debt and tax rates).
The current earnings yield for Winnebago is 16.86%%, in comparison to 3.37% for the S&P 500 and 1.48% for the 10-year treasury bond. The median earnings yield for the Auto/Truck industry is 2.64%.
What does Winnebago Price-to-Earnings Ratio (P/E) tell investors about the company?
The price-to-earnings ratio (P/E) is a relatively popular metric used by investors and analysts for valuing a company’s stock. The P/E ratio can be used to show how a stock’s valuation compares to other companies and the total market. Investors use the P/E ratio to determine what the market is willing to pay today based on a company’s past or future earnings. A high P/E ratio could mean that a stock’s price is too high relative to earnings, which could be a signal that a stock is currently overvalued. In turn, a low P/E ratio could indicate that a company’s current stock price is low relative to earnings.
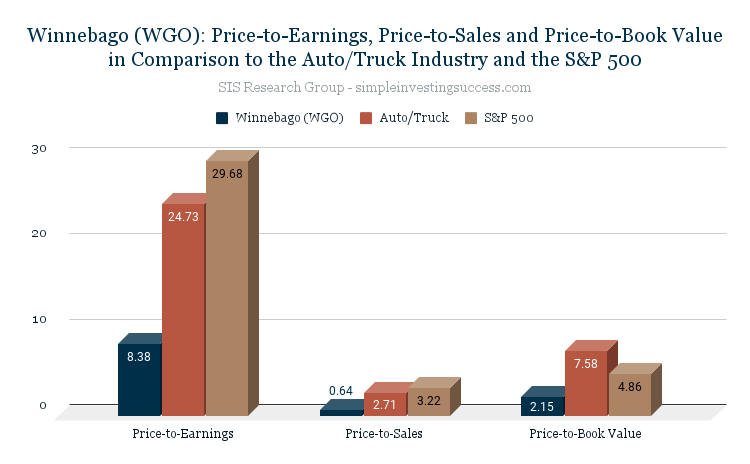
Winnebago is currently trading at a P/E of 8.38. The P/E for the Auto/Truck industry is 24.73 and the P/E for the S&P 500 is 29.68.
What is the current Price-to-Sales Ratio (P/S) for Winnebago?
The Price-to-Sales Ratio (P/S) looks at a company’s market cap and revenue to determine valuation. The P/S ratio is calculated by taking a company’s market cap and dividing by the total sales or revenue. The P/S ratio gives an idea of how much the market values every dollar of a company’s sales and can be effective in valuing unprofitable growth stocks or companies that are currently undergoing special situations or challenges. A lower the P/S ratio can be an indicator of good value.
Winnebago is currently trading at a P/S of 0.64. The P/S for the Auto/Truck industry is 2.71 and the P/S for the S&P 500 is 3.22.
How does Winnebago Price-to-BookRatio (P/B) compare to the Auto/Truck industry?
Price-to-book value (P/B) is the ratio of the market value of a company’s shares divided by its book value of equity (the value of it’s assets on the books). The book value is the difference between the book value of assets and liabilities. Typically, investors use the P/B ratio to assess if a stock is valued properly (a value of one means that the stock price is trading in line with the book value of the company). A company with a high P/B ratio could mean the stock price is overvalued as well as the converse.
Winnebago P/B ratio is 2.15. The P/B for the Auto/Truck industry is 7.58 and the P/B for the S&P 500 is 4.86.
How attractive is Winnebago Return on Invested Capital (ROIC) to investors?
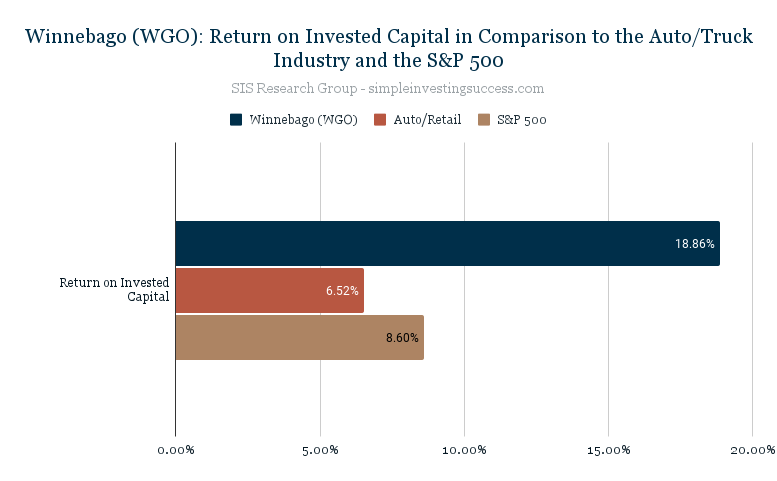
Investors use the return on invested capital (ROIC) to assess how efficient a company is at turning capital into profits. The ROIC is the amount of money a company makes on it’s investments that is above the average cost of debt and equity.
Investors can use the ROIC to provide context for metrics like the (P/E) ratio. For instance, when used in isolation a low P/E ratio could suggest a company is oversold but the decline could be because a company is no longer generating value for shareholders. Conversely, companies that consistently generate high rates of ROIC can plausibly trade at a premium compared to other stocks, even if their P/E ratios are high.
Winnebago ROIC is currently 18.86% in comparison to 6.52% for the Auto/Truck industry and 8.60% for the S&P 500.
What is Winnebago YTD Performance in comparison to its industry and the total market?
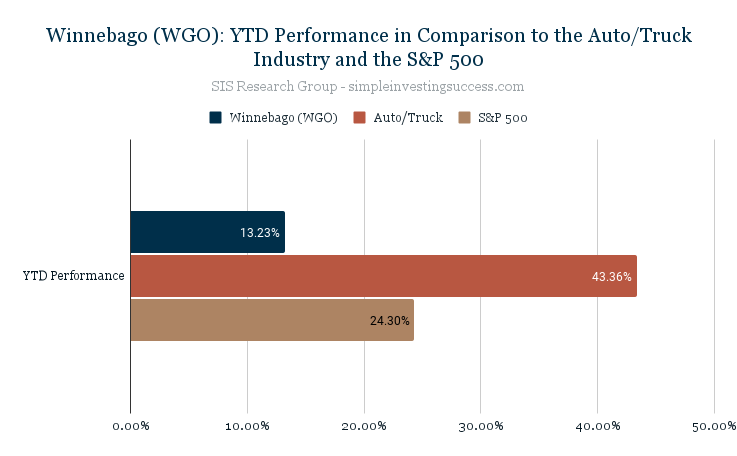
The year-to-date (YTD) performance is the amount of profit/loss realized by a stock since the first trading day of the current calendar year.
The YTD performance for Winnebago is 13.23%. The Auto/Truck industry has a YTD performance of 43.36% in comparison to the YTD S&P 500 performance of 24.30%.
Recent Financial Results
- Revenues for Q4 of $1B, an increase of 40.4% compared to $737.8M for the FY 2020
- Revenue growth compared to the Fiscal 2020 period was driven by strong end consumer demand, pricing initiatives across all segments driven by higher material and component costs, and segment and product mix
- Gross profit of $187.2M compared to $122.5M for FY 2020 driven by increased unit growth and pricing, including lower discounts and allowances
- Gross profit margin increased to 18.1% in the quarter driven by fixed cost leverage, increased pricing, including lower discounts and allowances, and profitability initiatives
- Operating income of $120M for the quarter, an increase of 75.4% compared to $68.4M for the fourth quarter last year
- FY 2021 Q4 net income of $84.1M, an increase of 98.0% compared to $42.5M in the fourth quarter of 2020
- Q1 2022 reporting to be issued on December 17, 2021
WGO Stock Price Target: $87.61
Company Overview
Winnebago Industries manufactures and sells recreation vehicles and marine products primarily for use in leisure travel and outdoor recreation activities. The company operates in six segments: Grand Design Towables, Winnebago Towables, Winnebago Motorhomes, Newmar motorhomes, Chris-Craft Marine, and Winnebago Specialty Vehicles. It provides towable products that are non-motorized vehicles to be towed by automobiles, pickup trucks, SUVs, or vans for use as temporary living quarters for recreational travel and truck campers under the Winnebago and Grand Design brand names.
The company is also involved in the original equipment manufacturing of parts for other manufacturers and commercial vehicles and sells its products primarily through independent dealers in the US, Canada, and internationally. Winnebago Industries was incorporated in 1958 and is based in Forest City, Iowa. The current CEO is Michael Happe.
Be sure to add Winnebago (WGO) to your Watch List and if you haven’t done so already, check in on the performance of our Current Portfolio. Keep it simple and always do your due diligence.
This material is provided for informational purposes only and is not financial advice. The information contained herein should not solely be used for the formation of an investment decision, whether you are a long term or short term investor.