
Tutor Perini (TPC) Company Overview & Stock Price Forecast
This article provides a brief analysis and stock rating for Tutor Perini (TPC) including an updated stock price target. Additional data on the company’s earnings yield, price/earnings ratio, return on invested capital and YTD performance are discussed as well.

Tutor Perini Fundamentals
Stock Price Target: $15.71
In the section below, we discuss the earnings yield, P/E, return on invested capital and YTD performance for Tutor Perini in comparison to the Construction industry and the S&P 500.
Tutor Perini is a Small Cap company with a Market Cap of $519.8M.
How are investors using Tutor Perini earnings yield to assess the company?
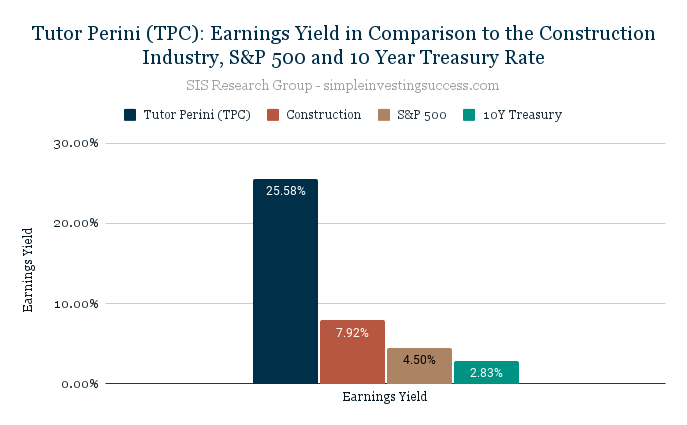
The earnings yield is used to show the percentage of a company’s earnings per share. Investors typically use earnings yield to determine which assets are underpriced or overpriced relative to other variables, like sector, industry or bond yields. Simply put, the earnings yield of a company can be used to assess how expensive a company is in relation to the earnings that are generated. When valuing companies, the SIS Research Group does not utilize the inverse P/E ratio to calculate the earnings yield. Instead, we use an adjusted earning yield calculation to capture variation amongst companies (i.e. debt and tax rates).
The current earnings yield for Tutor Perini is 25.58%, in comparison to 4.50% for the S&P 500 and 2.83% for the 10-year treasury bond. The median earnings yield for the Construction industry is 7.92%.
What does Tutor Perini Price-to-Earnings Ratio (P/E) tell investors about the company?
The price-to-earnings ratio (P/E) is a relatively popular metric used by investors and analysts for valuing a company’s stock. The P/E ratio can be used to show how a stock’s valuation compares to other companies and the total market. Investors use the P/E ratio to determine what the market is willing to pay today based on a company’s past or future earnings. A high P/E ratio could mean that a stock’s price is too high relative to earnings, which could be a signal that a stock is currently overvalued. In turn, a low P/E ratio could indicate that a company’s current stock price is low relative to earnings.
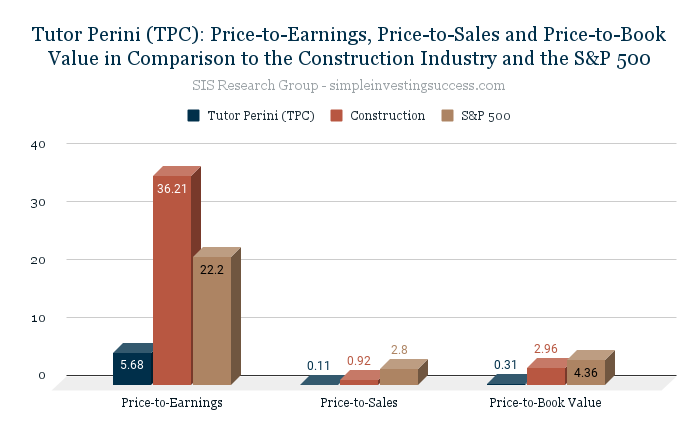
Tutor Perini is currently trading at a P/E of 5.68. The P/E for the Construction industry is 36.21 and the P/E for the S&P 500 is 22.20.
What is the current Price-to-Sales Ratio (P/S) for Tutor Perini?
The Price-to-Sales Ratio (P/S) looks at a company’s market cap and revenue to determine valuation. The P/S ratio is calculated by taking a company’s market cap and dividing by the total sales or revenue. The P/S ratio gives an idea of how much the market values every dollar of a company’s sales and can be effective in valuing unprofitable growth stocks or companies that are currently undergoing special situations or challenges. A lower the P/S ratio can be an indicator of good value.
Tutor Perini is currently trading at a P/S of 0.11. The P/S for the Construction industry is 0.92 and the P/S for the S&P 500 is 2.80.
How does Tutor Perini Price-to-BookRatio (P/B) compare to the Construction industry?
Price-to-book value (P/B) is the ratio of the market value of a company’s shares divided by its book value of equity (the value of it’s assets on the books). The book value is the difference between the book value of assets and liabilities. Typically, investors use the P/B ratio to assess if a stock is valued properly (a value of one means that the stock price is trading in line with the book value of the company). A company with a high P/B ratio could mean the stock price is overvalued as well as the converse.
Tutor Perini P/B ratio is 0.31. The P/B for the Construction industry is 2.96 and the P/B for the S&P 500 is 4.36.
How attractive is Tutor Perini Return on Invested Capital (ROIC) to investors?
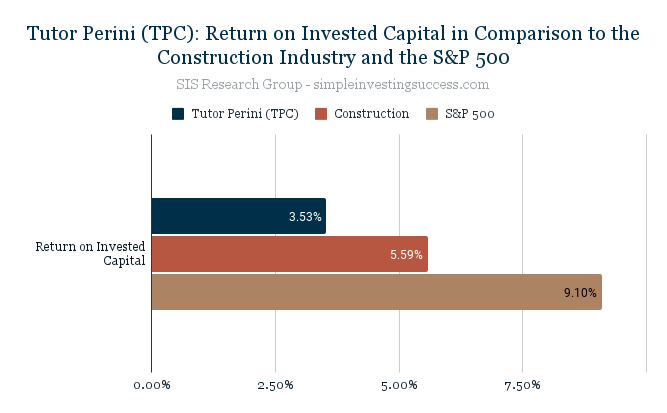
Investors use the return on invested capital (ROIC) to assess how efficient a company is at turning capital into profits. The ROIC is the amount of money a company makes on it’s investments that is above the average cost of debt and equity.
Investors can use the ROIC to provide context for metrics like the (P/E) ratio. For instance, when used in isolation a low P/E ratio could suggest a company is oversold but the decline could be because a company is no longer generating value for shareholders. Conversely, companies that consistently generate high rates of ROIC can plausibly trade at a premium compared to other stocks, even if their P/E ratios are high.
Tutor Perini ROIC is currently 3.53% in comparison to 5.59% for the Construction industry and 9.10% for the S&P 500.
How has TPC stock performed over the past year? What is the current analyst price target?
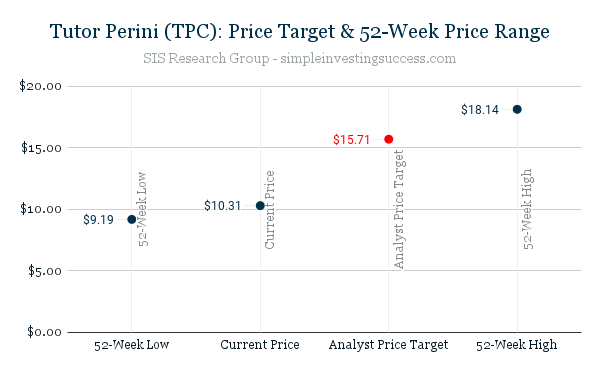
Over the past 52 weeks, Tutor Perini has traded between the range of $9.19 and $18.14.
The current Analyst Price Target for Tutor Perini is $15.71.
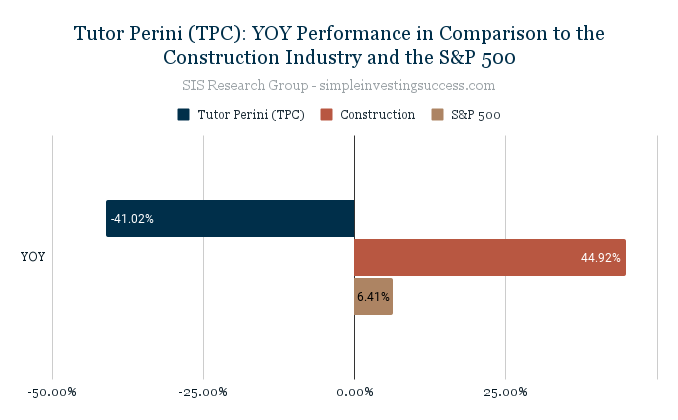
What is Tutor Perini YOY Performance in comparison to its industry and the total market?
The YOY performance for Tutor Perini is -41.02%. The Construction industry has a YOY performance of 44.92% in comparison to the YOY S&P 500 performance of 6.41%.
Recent Financial Results (Q4, 2021)
- Revenue for the fourth quarter and full year of 2021 was $1B and $4.6B, down 23% and 13%, respectively, compared to the same periods last year
- Income from construction operations for the fourth quarter and full year of 2021 was $56.3M and $226.8M, down 24% and 14%, respectively, compared to the same periods in 2020
- Net income for the fourth quarter and full year of 2021 was $29.3M, and $91.9M respectively, compared to $35.5M and $108.4M respectively, for the same periods in 2020
- Backlog at December 2021 was $8.2B, essentially level compared to $8.3B at the end of 2020
- The recently enacted $1.2T bipartisan Infrastructure Investment and Jobs Act is expected to significantly benefit the Company’s business by funding many new and existing large infrastructure projects that the Company is involved with or will be pursuing over the next several years
Stock Price Target: $15.71
Company Overview
Tutor Perini Corporation, a construction company, provides diversified general contracting, construction management, and design-build services to private customers and public agencies worldwide. It operates through three segments: Civil, Building, and Specialty Contractors.
It also offers general contracting, pre-construction planning, and project management services, including planning and scheduling of manpower, equipment, materials, and subcontractors; and self-performed construction services, such as site work, concrete forming and placement, steel erection, electrical, plumbing, HVAC, and mechanical. Tutor Perini Corporation was founded in 1894 and is headquartered in Sylmar, California. The current CEO is Ronald Tutor.
Be sure to add Tutor Perini (TPC) to your Watch List and if you haven’t done so already, check in on the performance of our Current Portfolio. Keep it simple and always do your due diligence.
This material is provided for informational purposes only and is not financial advice. The information contained herein should not solely be used for the formation of an investment decision, whether you are a long term or short term investor.