
Thor Industries (THO) Company Overview & Stock Price Forecast
This article provides a brief analysis and stock rating for THOR Industries (THO) including an updated stock price target. Additional data on the company’s earnings yield, price/earnings ratio, return on invested capital and YTD performance are discussed as well.

THOR Industries Fundamentals
Stock Price Target: $131.29
In the section below, we discuss the earnings yield, P/E, return on invested capital and YTD performance for THOR Industries in comparison to the Auto/Truck industry and the S&P 500.
THOR Industries is a Small Cap company with a Market Cap of $788.4M.
How are investors using THOR Industries earnings yield to assess the company?
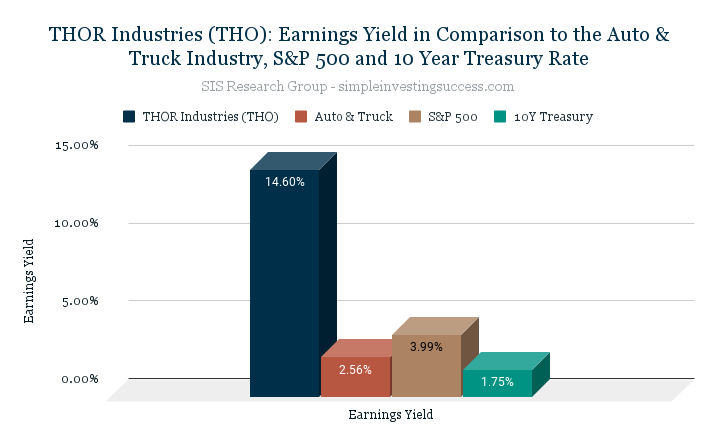
The earnings yield is used to show the percentage of a company’s earnings per share. Investors typically use earnings yield to determine which assets are underpriced or overpriced relative to other variables, like sector, industry or bond yields. Simply put, the earnings yield of a company can be used to assess how expensive a company is in relation to the earnings that are generated. When valuing companies, the SIS Research Group does not utilize the inverse P/E ratio to calculate the earnings yield. Instead, we use an adjusted earning yield calculation to capture variation amongst companies (i.e. debt and tax rates).
The current earnings yield for THOR Industries is 14.60%, in comparison to 3.99% for the S&P 500 and 1.75% for the 10-year treasury bond. The median earnings yield for the Auto & Truck industry is 2.56%.
What does THOR Industries Price-to-Earnings Ratio (P/E) tell investors about the company?
The price-to-earnings ratio (P/E) is a relatively popular metric used by investors and analysts for valuing a company’s stock. The P/E ratio can be used to show how a stock’s valuation compares to other companies and the total market. Investors use the P/E ratio to determine what the market is willing to pay today based on a company’s past or future earnings. A high P/E ratio could mean that a stock’s price is too high relative to earnings, which could be a signal that a stock is currently overvalued. In turn, a low P/E ratio could indicate that a company’s current stock price is low relative to earnings.
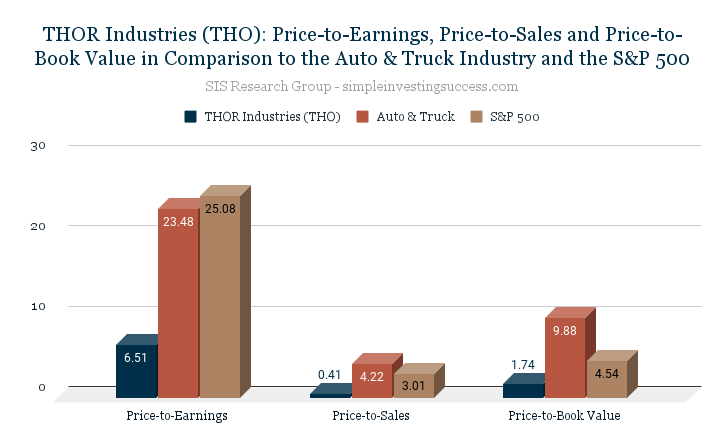
THOR Industries is currently trading at a P/E of 6.51. The P/E for the Auto & Truck industry is 23.48 and the P/E for the S&P 500 is 25.08.
What is the current Price-to-Sales Ratio (P/S) for THOR Industries?
The Price-to-Sales Ratio (P/S) looks at a company’s market cap and revenue to determine valuation. The P/S ratio is calculated by taking a company’s market cap and dividing by the total sales or revenue. The P/S ratio gives an idea of how much the market values every dollar of a company’s sales and can be effective in valuing unprofitable growth stocks or companies that are currently undergoing special situations or challenges. A lower the P/S ratio can be an indicator of good value.
THOR Industries is currently trading at a P/S of 0.41. The P/S for the Auto & Truck industry is 4.22 and the P/S for the S&P 500 is 3.01.
How does THOR Industries Price-to-BookRatio (P/B) compare to the Auto/Truck industry?
Price-to-book value (P/B) is the ratio of the market value of a company’s shares divided by its book value of equity (the value of it’s assets on the books). The book value is the difference between the book value of assets and liabilities. Typically, investors use the P/B ratio to assess if a stock is valued properly (a value of one means that the stock price is trading in line with the book value of the company). A company with a high P/B ratio could mean the stock price is overvalued as well as the converse.
THOR Industries P/B ratio is 1.74. The P/B for the Auto & Truck industry is 9.88 and the P/B for the S&P 500 is 4.54.
How attractive is THOR Industries Return on Invested Capital (ROIC) to investors?
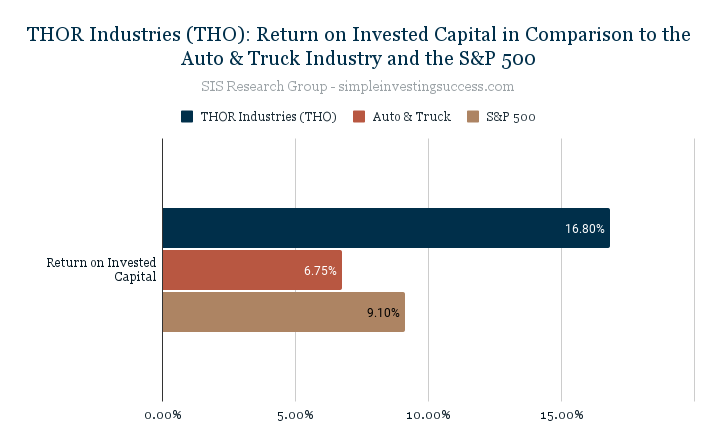
Investors use the return on invested capital (ROIC) to assess how efficient a company is at turning capital into profits. The ROIC is the amount of money a company makes on it’s investments that is above the average cost of debt and equity.
Investors can use the ROIC to provide context for metrics like the (P/E) ratio. For instance, when used in isolation a low P/E ratio could suggest a company is oversold but the decline could be because a company is no longer generating value for shareholders. Conversely, companies that consistently generate high rates of ROIC can plausibly trade at a premium compared to other stocks, even if their P/E ratios are high.
THOR Industries ROIC is currently 16.80% in comparison to 6.75% for the Auto & Truck industry and 9.10% for the S&P 500.
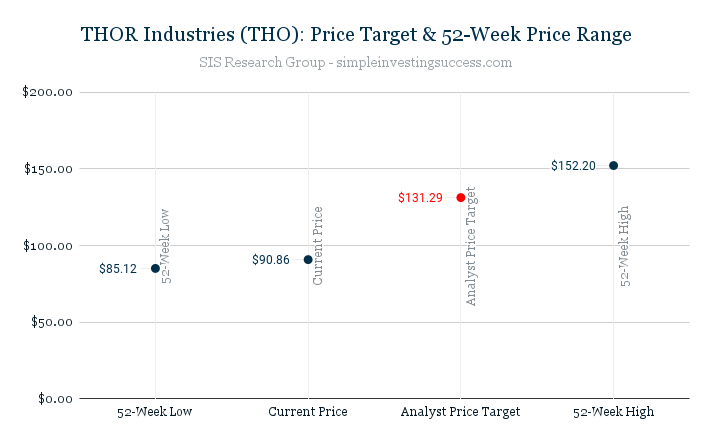
How has THO stock performed over the past year? What is the current analyst price target?
Over the past 52 weeks, THOR Industries has traded between the range of $85.12 and $152.20.
The current Analyst Price Target for THOR Industries is $131.29.
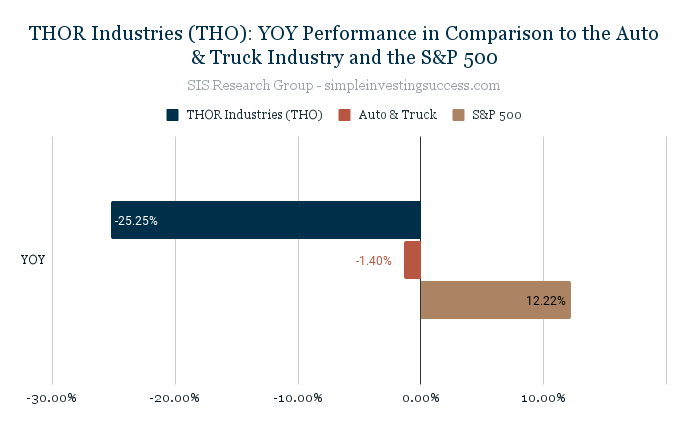
What is THOR Industries YOY Performance in comparison to its industry and the total market?
The YOY performance for THOR Industries is -25.25%. The Auto & Truck industry has a YOY performance of -1.40% in comparison to the YOY S&P 500 performance of 12.22%.
Recent Financial Results (Q1, 2022)
- Net sales for the first quarter of $3.96B, an increase of 56.0% as compared to the first quarter of the prior fiscal year
- Consolidated gross profit margin for the first quarter of 16.6%
- Earnings per share for the first quarter were $4.34 per diluted share, an increase of 111.7% as compared to $2.05 per diluted share in the same period of the prior fiscal year
- Consolidated RV backlog as of October 2021 was $18.07B, an increase of over 100% as compared to RV backlog as of October 2020
- Company acquired Airxcel, a significant supplier to the North American RV industry.
Stock Price Target: $131.29
Company Overview
THOR Industries designs, manufactures, and sells recreational vehicles (RVs), and related parts and accessories in the United States, Canada, and Europe. The company offers travel trailers; gasoline and diesel Class A, Class B, and Class C motorhomes; conventional travel trailers and fifth wheels; luxury fifth wheels; and motorcaravans, caravans, campervans, and urban vehicles. It also provides aluminum extrusion and specialized component products to RV and other manufacturers; and digital products and services for RVs.
The company provides its products through independent and non-franchise dealers. The company was founded in 1980 and is based in Elkhart, Indiana. The current CEO is Robert W. Martin.
Be sure to add THOR Industries (THO) to your Watch List and if you haven’t done so already, check in on the performance of our Current Portfolio. Keep it simple and always do your due diligence.
This material is provided for informational purposes only and is not financial advice. The information contained herein should not solely be used for the formation of an investment decision, whether you are a long term or short term investor.