
Thryv Inc. (THRY) Company Overview & Stock Price Forecast
This article provides a brief analysis and stock rating for Thryv Holdings (THRY) stock including an updated price target. Additional data on the company’s earnings yield, price/earnings ratio, return on invested capital and YTD performance are discussed as well.

Thryv Holdings Fundamentals
Stock Price Target: $41.06
In the section below, we discuss the earnings yield, P/E, return on invested capital and YTD performance for Thryv Holdings in comparison to the Media (Advertising) industry and the S&P 500.
Thryv Holdings is a Small Cap company with a Market Cap of $1.04B.
How are investors using THRY stock earnings yield to assess the company?
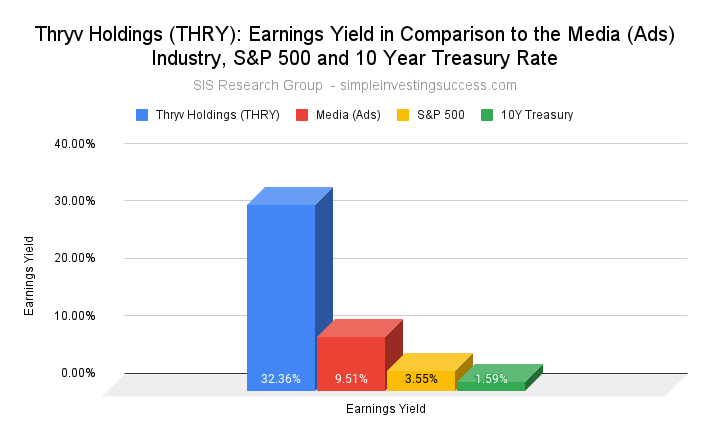
The earnings yield is used to show the percentage of a company’s earnings per share. Investors typically use earnings yield to determine which assets are underpriced or overpriced relative to other variables, like sector, industry or bond yields. Simply put, the earnings yield of a company can be used to assess how expensive a company is in relation to the earnings that are generated. When valuing companies, the SIS Research Group does not utilize the inverse P/E ratio to calculate the earnings yield. Instead, we use an adjusted earning yield calculation to capture variation amongst companies (i.e. debt and tax rates).
The current earnings yield for Thryv Holdings is 32.36%%, in comparison to 3.55% for the S&P 500 and 1.59% for the 10-year treasury bond. The median earnings yield for the Media (Ads) industry is 9.51%.
What does the Price-to-Earnings Ratio (P/E) for THRY stock tell investors about the company?
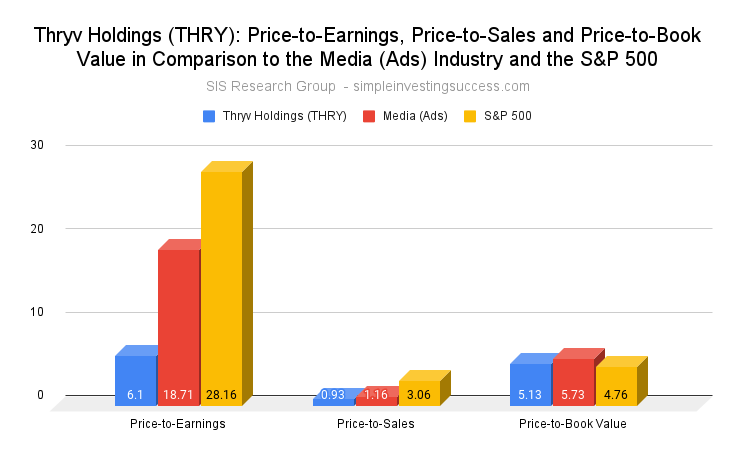
The price-to-earnings ratio (P/E) is a relatively popular metric used by investors and analysts for valuing a company’s stock. The P/E ratio can be used to show how a stock’s valuation compares to other companies and the total market. Investors use the P/E ratio to determine what the market is willing to pay today based on a company’s past or future earnings. A high P/E ratio could mean that a stock’s price is too high relative to earnings, which could be a signal that a stock is currently overvalued. In turn, a low P/E ratio could indicate that a company’s current stock price is low relative to earnings.
Thryv Holdings is currently trading at a P/E of 6.1. The P/E for the Media (Ads) industry is 18.71 and the P/E for the S&P 500 is 28.16.
What is the current Price-to-Sales Ratio (P/S) for Thryv Holdings?
The Price-to-Sales Ratio (P/S) looks at a company’s market cap and revenue to determine valuation. The P/S ratio is calculated by taking a company’s market cap and dividing by the total sales or revenue. The P/S ratio gives an idea of how much the market values every dollar of a company’s sales and can be effective in valuing unprofitable growth stocks or companies that are currently undergoing special situations or challenges. A lower the P/S ratio can be an indicator of good value.
Thryv Holdings is currently trading at a P/S of 0.93. The P/S for the Media (Ads) industry is 1.16 and the P/S for the S&P 500 is 3.06.
How does Thry Holdings Price-to-BookRatio (P/B) compare to the Media (Advertising) industry?
Price-to-book value (P/B) is the ratio of the market value of a company’s shares divided by its book value of equity (the value of it’s assets on the books). The book value is the difference between the book value of assets and liabilities. Typically, investors use the P/B ratio to assess if a stock is valued properly (a value of one means that the stock price is trading in line with the book value of the company). A company with a high P/B ratio could mean the stock price is overvalued as well as the converse.
Thryv Holdings P/B ratio is 5.13. The P/B for the Media (Ads) industry is 5.73 and the P/B for the S&P 500 is 4.76.
How attractive is Thryv Holdings Return on Invested Capital (ROIC) to investors?
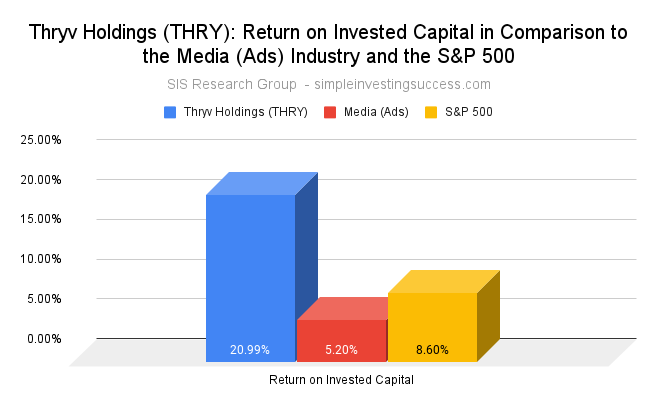
Investors use the return on invested capital (ROIC) to assess how efficient a company is at turning capital into profits. The ROIC is the amount of money a company makes on it’s investments that is above the average cost of debt and equity.
Investors can use the ROIC to provide context for metrics like the (P/E) ratio. For instance, when used in isolation a low P/E ratio could suggest a company is oversold but the decline could be because a company is no longer generating value for shareholders. Conversely, companies that consistently generate high rates of ROIC can plausibly trade at a premium compared to other stocks, even if their P/E ratios are high.
Thryv Holdings ROIC is currently 20.99% in comparison to 5.20% for the Media (Ads) industry and 8.60% for the S&P 500.
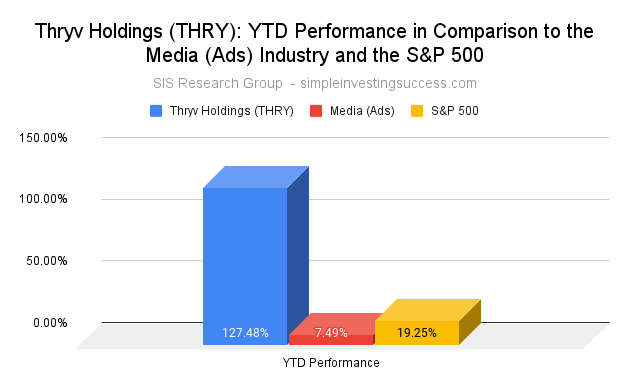
What is Thryv Holdings YTD Performance in comparison to its industry and the total market?
The year-to-date (YTD) performance is the amount of profit/loss realized by a stock since the first trading day of the current calendar year.
The YTD performance for Thryv Holdings is 127.48%. The Media (Ads) industry has a YTD performance of 7.49% in comparison to the YTD S&P 500 performance of 19.25%.
Recent Financial Results
- Q2 2021 US SaaS revenue of $41.4M, a 32.3% increase YoY
- US Marketing Services revenue reported of $202.8M
- Thryv International Marketing Services revenue of $46.9M (net of a $27.8M deferred revenue)
- EBITDA (non-adjusted) $299.7M
- Consolidated gross profit of $178.4M
- US SaaS YoY revenue guidance raised to roughly 23% (this represents a $157M – $160M increase from the previous $151M – $153M)
- US Marketing Services revenue guidance of $750M – $770M (up from previous $740M – $760M)
Stock Price Target: $41.06
Company Overview
Thryv Holdings provides digital marketing solutions and cloud-based tools to small-to-medium sized businesses (SMBs) in the US. The company operates through three segments: SaaS (Software as a Service), Marketing and Thryv International.
The SaaS segment provides an end-to-end customer platform, integrated with Google and ThryvPay, a payment solution that allows users to get paid through credit card and ACH.
The Marketing Services segment provides print and digital solutions, including the company’s internet yellow pages (yellowpages.com, superpages.com and dexknows.com), search engine marketing as well as SEO tools. The Thryv International segment provides digital marketing and directory services.
The company was founded in 2013 (as Dex Media Holdings) and changed its name to Thryv Holdings in July 2019. The company is headquartered in Grapevine, TX and the current CEO is Joe Walsh.
Be sure to add Thryv Holdings (THRY) to your Watch List and if you haven’t done so already, check in on the performance of our Current Portfolio. Keep it simple and always do your due diligence.
This material is provided for informational purposes only and is not financial advice. The information contained herein should not solely be used for the formation of an investment decision, whether you are a long term or short term investor.