
Harte-Hanks (HHS) Company Overview & Stock Price Forecast
This article provides a brief analysis and stock rating for Harte-Hanks Inc. (HHS) including an updated stock price target. Additional data on the company’s earnings yield, price/earnings ratio, return on invested capital and YTD performance are discussed as well.

Harte-Hanks Fundamentals
Stock Price Target: $15.92
In the section below, we discuss the earnings yield, P/E, return on invested capital and YTD performance for Harte-Hanks in comparison to the Advertising industry and the S&P 500.
Harte-Hanks is a Micro Cap company with a Market Cap of $51.68M.
How are investors using Harte-Hanks earnings yield to assess the company?
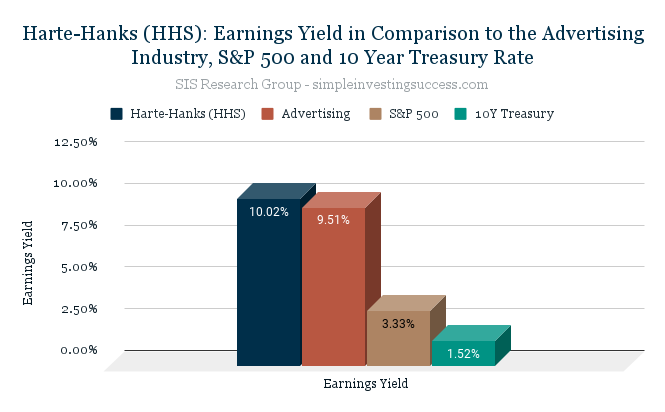
The earnings yield is used to show the percentage of a company’s earnings per share. Investors typically use earnings yield to determine which assets are underpriced or overpriced relative to other variables, like sector, industry or bond yields. Simply put, the earnings yield of a company can be used to assess how expensive a company is in relation to the earnings that are generated. When valuing companies, the SIS Research Group does not utilize the inverse P/E ratio to calculate the earnings yield. Instead, we use an adjusted earning yield calculation to capture variation amongst companies (i.e. debt and tax rates).
The current earnings yield for Harte-Hanks is 10.02%, in comparison to 3.33% for the S&P 500 and 1.52% for the 10-year treasury bond. The median earnings yield for the Advertising industry is 9.51%.
What does Harte-Hanks Price-to-Earnings Ratio (P/E) tell investors about the company?
The price-to-earnings ratio (P/E) is a relatively popular metric used by investors and analysts for valuing a company’s stock. The P/E ratio can be used to show how a stock’s valuation compares to other companies and the total market. Investors use the P/E ratio to determine what the market is willing to pay today based on a company’s past or future earnings. A high P/E ratio could mean that a stock’s price is too high relative to earnings, which could be a signal that a stock is currently overvalued. In turn, a low P/E ratio could indicate that a company’s current stock price is low relative to earnings.
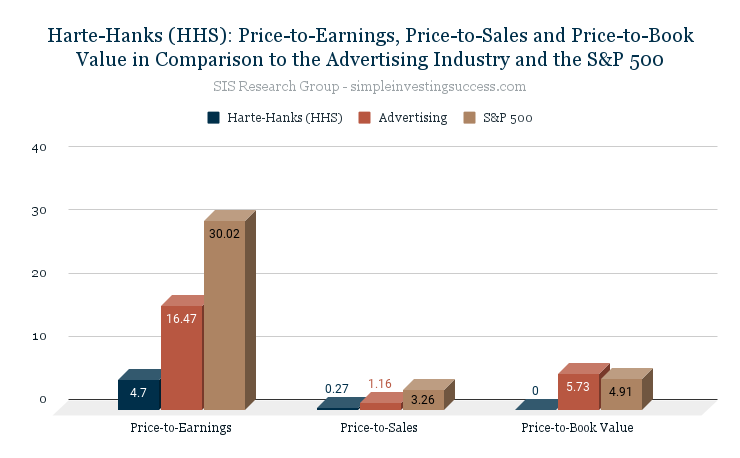
Harte-Hanks is currently trading at a P/E of 4.70. The P/E for the Advertising industry is 16.47 and the P/E for the S&P 500 is 30.02.
What is the current Price-to-Sales Ratio (P/S) for Harte-Hanks?
The Price-to-Sales Ratio (P/S) looks at a company’s market cap and revenue to determine valuation. The P/S ratio is calculated by taking a company’s market cap and dividing by the total sales or revenue. The P/S ratio gives an idea of how much the market values every dollar of a company’s sales and can be effective in valuing unprofitable growth stocks or companies that are currently undergoing special situations or challenges. A lower the P/S ratio can be an indicator of good value.
Harte-Hanks is currently trading at a P/S of 0.27. The P/S for the Advertising industry is 1.16 and the P/S for the S&P 500 is 3.26.
How does Harte-Hanks Price-to-BookRatio (P/B) compare to the Advertising industry?
Price-to-book value (P/B) is the ratio of the market value of a company’s shares divided by its book value of equity (the value of it’s assets on the books). The book value is the difference between the book value of assets and liabilities. Typically, investors use the P/B ratio to assess if a stock is valued properly (a value of one means that the stock price is trading in line with the book value of the company). A company with a high P/B ratio could mean the stock price is overvalued as well as the converse.
Harte-Hanks does not currently have a reported P/B. The P/B for the Advertising industry is 5.73 and the P/B for the S&P 500 is 4.91.
How attractive is Harte-Hanks Return on Invested Capital (ROIC) to investors?
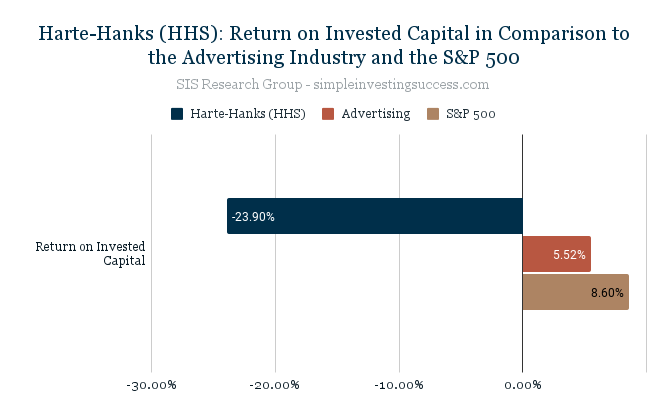
Investors use the return on invested capital (ROIC) to assess how efficient a company is at turning capital into profits. The ROIC is the amount of money a company makes on it’s investments that is above the average cost of debt and equity.
Investors can use the ROIC to provide context for metrics like the (P/E) ratio. For instance, when used in isolation a low P/E ratio could suggest a company is oversold but the decline could be because a company is no longer generating value for shareholders. Conversely, companies that consistently generate high rates of ROIC can plausibly trade at a premium compared to other stocks, even if their P/E ratios are high.
Harte-Hanks ROIC is currently -23.90% in comparison to 5.52% for the Advertising industry and 8.60% for the S&P 500.
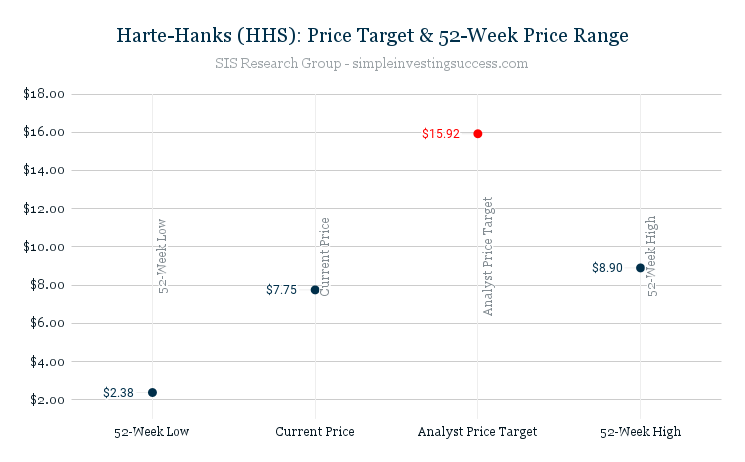
How has HHS stock performed over the past year? What is the current analyst price target?
Over the past 52 weeks, Harte-Hanks has traded between the range of $2.38 and $8.90.
The current Analyst Price Target for Harte-Hanks is $15.92.
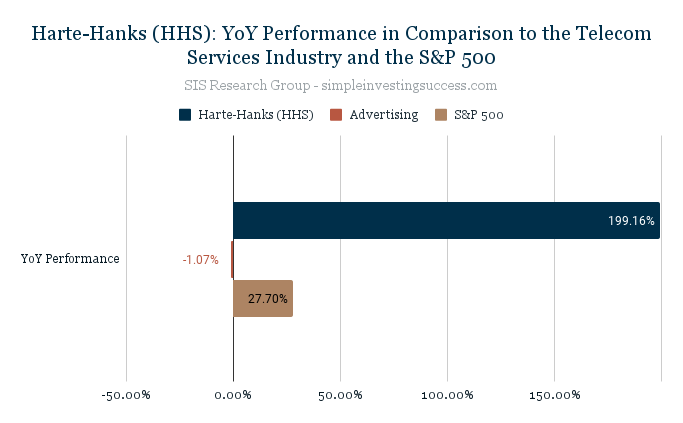
What is Harte-Hanks YoY Performance in comparison to its industry and the total market?
The year-over-year (YoY) performance is the amount of profit/loss realized by a stock over a one year period from the present date.
The YoY performance for Harte-Hanks is 199.16%. The Advertising industry has a YTD performance of -1.07% in comparison to the YTD S&P 500 performance of 27.70%.
Recent Financial Results
- Reported revenue increase of 4% to $49.6M , compared to $47.7M in the same period last year
- Operating income of $4.2M , compared to operating income of $0.8M in the same period last year
- Net income of $4.4M , compared to net loss of -$1.6M in the same period last year
- EBITDA improved to $4.8M compared to $1.5M in the same period last year
Stock Price Target: $15.92
Company Overview
Harte Hanks operates as a customer experience company in the US and internationally. It operates through three segments: Marketing Services, Customer Care and Fulfillment & Logistics Services.
In addition, the company provides product and mail fulfillment solutions, such as printing on demand, managing product recalls, and distributing literature and promotional products; third-party logistics and freight optimization services; and full-service direct mail services. It primarily serves B2B, consumer brand, financial services, retail, and healthcare vertical markets.
Harte Hanks, Inc. was founded in 1923 and is headquartered in Austin, Texas. The current CEO is Brian Linscott.
Be sure to add Harte-Hanks (HHS) to your Watch List and if you haven’t done so already, check in on the performance of our Current Portfolio. Keep it simple and always do your due diligence.
This material is provided for informational purposes only and is not financial advice. The information contained herein should not solely be used for the formation of an investment decision, whether you are a long term or short term investor.