FutureFuel Corp. (FF): A Comprehensive Analysis of Earnings Yield, P/E, ROI and YTD Performance Against the Speciality Chemical Industry and S&P 500
In this article, we’ll provide an in-depth analysis of FutureFuel (FF), including an updated stock price target and key financial metrics such as earnings yield, price-to-earnings ratio, return on invested capital and year-to-date performance. Our comprehensive stock rating will help investors make informed decisions about FutureFuel’s potential as a near-term and long-term investment. FutureFuel is a Small Cap company with a Market Cap of $335.6M.
Stock Price Target: $10.98
FutureFuel Background
FutureFuel is a leading manufacturer of diversified chemical products and biofuels, operating from its base in Batesville, Arkansas. The company produces and markets specialty chemicals for specific customers in several key industries, including printing inks, detergents, coatings, and polymers. Additionally, FutureFuel produces biofuels and renewable chemicals that help reduce carbon emissions and promote sustainable energy sources.
What’s the Significance of FutureFuel earnings yield For Investors Assessing the Company?
Earnings Yield: An Essential Metric for Investors to Evaluate A Companies’ Relative Value
At SCRG, we utilize an adjusted earning yield calculation that captures variations amongst companies, such as debt and tax rates, rather than relying on the inverse P/E ratio. By using this method, we can better determine if a company is underpriced or overpriced relative to other variables like sector, industry, or bond yields.
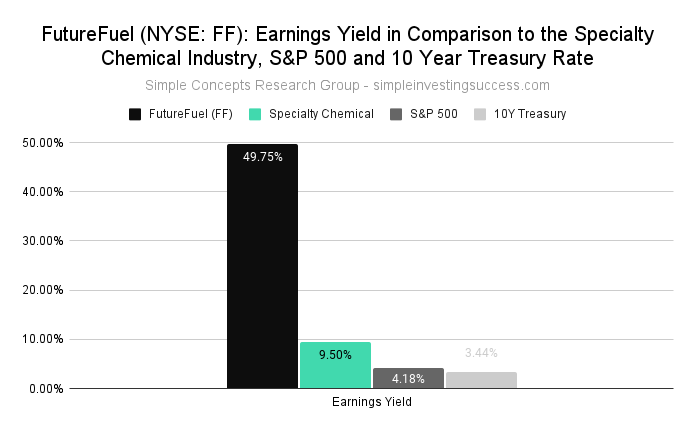
FutureFuel’s current earnings yield stands at 49.75%, compared to 4.18% for the S&P 500 and 3.44% for the 10-year treasury bond. The median earnings yield for the Specialty Chemical industry is 9.50%.
FutureFuel‘s Price-to-Earnings Ratio (P/E): What It Reveals to Investors About the Company?
Understanding FutureFuels’ Foods’ Price-to-Earnings Ratio (P/E) and Its Significance for Investors
P/E ratio is a commonly used metric to assess a company’s stock valuation relative to other companies and the market. By comparing a company’s past or future earnings to its current market price, investors can evaluate if a stock is currently overvalued or undervalued. A high P/E ratio could indicate an overvalued stock, while a low P/E ratio could suggest an undervalued stock.
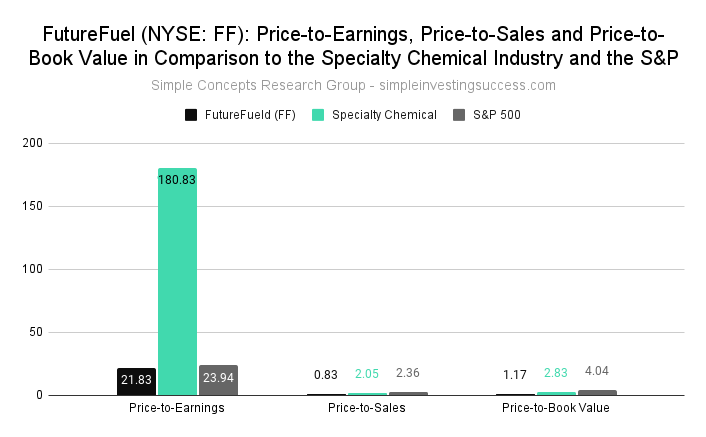
Currently, FutureFuel P/E ratio stands at 21.83, in comparison to the Specialty Chemical industry P/E ratio of 180.83 and the S&P 500’s P/E ratio of 23.94.
What’s FutureFuels‘ Current Price-to-Sales Ratio (P/S)?
Understanding FutureFuels’ Price-to-Sales Ratio (P/S) and Its Role in Valuation
(P/S) ratio is a metric that uses a company’s market capitalization and revenue to determine its value. It’s calculated by dividing a company’s market cap by its total sales or revenue. The P/S ratio offers insight into how much the market values each dollar of a company’s sales, making it useful for evaluating unprofitable growth stocks or companies facing unique challenges. A lower P/S ratio may indicate better value.
Currently, FutureFuel has a P/S ratio of 0.83, compared to the Specialty Chemical industry P/S ratio of 2.05 and the S&P 500’s P/S ratio of 2.36.
How does FutureFuel Price-to-BookRatio (P/B) Compare to the Specialty Chemical industry?
P/B is the ratio of a company’s market value to its book value of equity (the value of assets on its books). It’s a key metric used by investors to determine if a stock is fairly valued. A P/B of 1 indicates the stock is trading in line with its book value. A high P/B ratio could indicate the stock is overvalued, while a low P/B ratio could mean the stock is undervalued.
FutureFuel has a P/B ratio of 1.17, while the Specialty Chemical industry’s P/B is 2.83 and the S&P 500’s P/B ratio is 4.04.
How does FutureFuel Return on Invested Capital (ROIC) Compare to Industry Standards (& What Does This Mean for Investors?)
Investors use Return on Invested Capital (ROIC) to measure a company’s efficiency in generating profits from capital. ROIC is the amount of money a company earns from investments above the average cost of debt and equity. ROIC can provide context for metrics like the Price-to-Earnings (P/E) ratio, as a low P/E ratio could indicate that a company is oversold, but it could also mean that a company is no longer generating value for shareholders. Companies with consistently high ROIC may trade at a premium compared to other stocks, even if their P/E ratios are high.
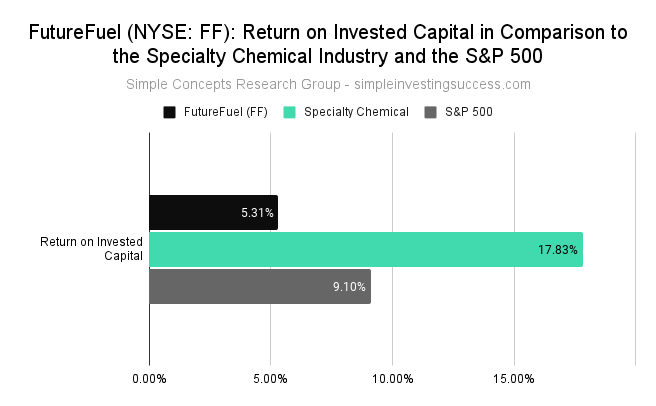
How attractive is FutureFuel’s ROIC to investors? FutureFuel has an ROIC of 5.31%, while the Specialty Chemical has 17.83% and the S&P 500 has 9.1%.
What Has Been the Performance of FF Over the Past Year? What Is the Current Analyst Price Target?
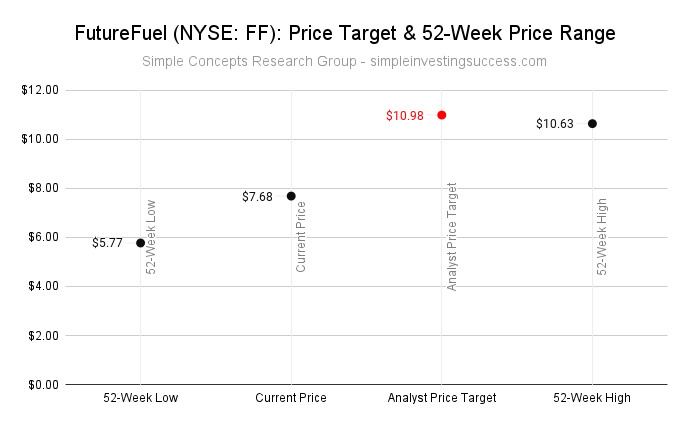
FutureFuel stock has traded between $5.77 and $10.63 over the past 52 weeks.
The current Analyst Price Target for FutureFuel is $10.98.
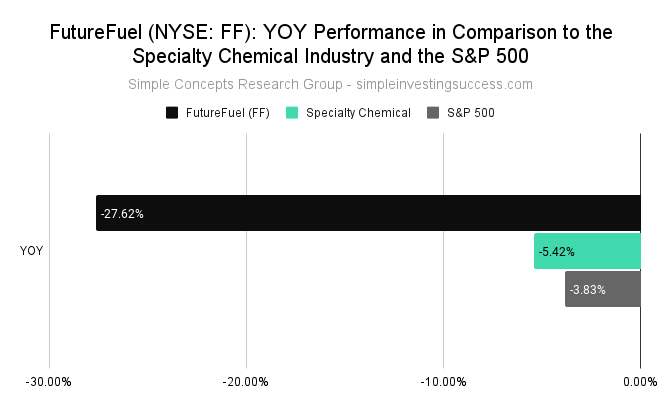
How Does FutureFuels’ Year-Over-Year (YOY) Performance Compare to Its Industry and the Overall Market?
FutureFuel has a YOY performance of -27.62%, while the Specialty Chemical industry has a YOY performance of -5.42% compared to the YOY S&P 500 performance of -3.83%.
Stock Price Target: $10.98
Recent Financial Results
- FutureFuel reported net income of $15.2 million or $0.35 per diluted share for 2022
- Adjusted EBITDA was $52.5 million, up 55% from $33.8 million in 2021
- Revenues for 2022 were $396.0 million, up 23% from $321.4 million in 2021
- Net income decreased to $14.9 million or $0.34 per diluted share in Q4 2022, compared to $22.3 million or $0.51 per diluted share in Q4 2021
- Fourth quarter 2022 revenues increased by 10% to $117.8 million from $107.1 million in Q4 2021.
Be sure to add FutureFuel (FF) to your Watch List. Keep it simple and always do your due diligence.
Please note that the information provided in this material is intended for informational purposes only and should not be construed as financial advice. The contents of this material are not intended to serve as a recommendation or endorsement to buy or sell any financial product or instrument, nor should it be solely relied upon in making investment decisions, whether you are a long-term or short-term investor. Please consult with a qualified financial advisor or professional before making any investment decisions.