
Escalade, Inc. (ESCA) Company Overview & Stock Price Forecast
This article provides a brief analysis and stock rating for Escalade, Inc. (ESCA) including an updated stock price target. Additional data on the company’s earnings yield, price/earnings ratio, return on invested capital and YTD performance are discussed as well.

Escalade Fundamentals
Stock Price Target: $22.91
In the section below, we discuss the earnings yield, P/E, return on invested capital and YTD performance for Escalade, Inc. in comparison to the Recreation industry and the S&P 500.
Escalade, Inc. is a Small Cap company with a Market Cap of $199.6M.
How are investors using Escalade earnings yield to assess the company?
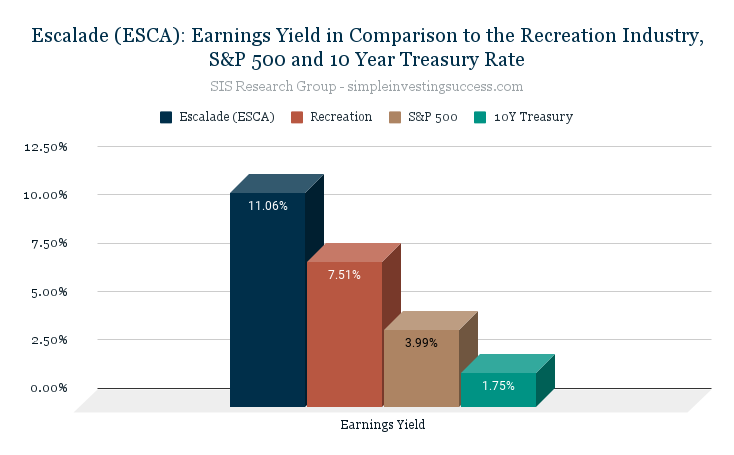
The earnings yield is used to show the percentage of a company’s earnings per share. Investors typically use earnings yield to determine which assets are underpriced or overpriced relative to other variables, like sector, industry or bond yields. Simply put, the earnings yield of a company can be used to assess how expensive a company is in relation to the earnings that are generated. When valuing companies, the SIS Research Group does not utilize the inverse P/E ratio to calculate the earnings yield. Instead, we use an adjusted earning yield calculation to capture variation amongst companies (i.e. debt and tax rates).
The current earnings yield for Escalade is 11.06%, in comparison to 3.99% for the S&P 500 and 1.75% for the 10-year treasury bond. The median earnings yield for the Recreation industry is 7.51%.
What does Escalade Price-to-Earnings Ratio (P/E) tell investors about the company?
The price-to-earnings ratio (P/E) is a relatively popular metric used by investors and analysts for valuing a company’s stock. The P/E ratio can be used to show how a stock’s valuation compares to other companies and the total market. Investors use the P/E ratio to determine what the market is willing to pay today based on a company’s past or future earnings. A high P/E ratio could mean that a stock’s price is too high relative to earnings, which could be a signal that a stock is currently overvalued. In turn, a low P/E ratio could indicate that a company’s current stock price is low relative to earnings.
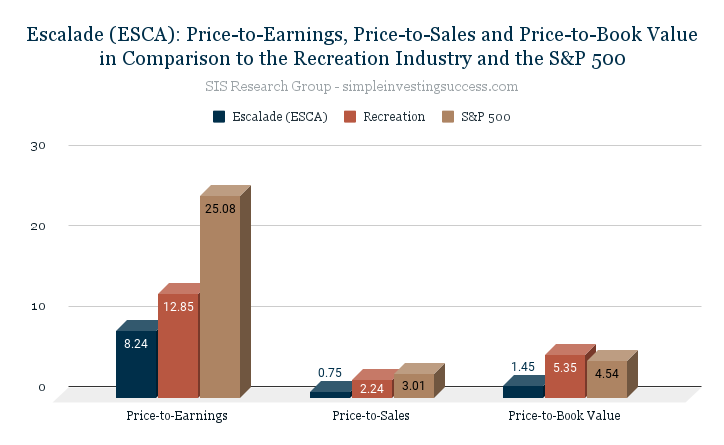
Escalade is currently trading at a P/E of 8.24. The P/E for the Recreation industry is 12.85 and the P/E for the S&P 500 is 25.08.
What is the current Price-to-Sales Ratio (P/S) for Escalade?
The Price-to-Sales Ratio (P/S) looks at a company’s market cap and revenue to determine valuation. The P/S ratio is calculated by taking a company’s market cap and dividing by the total sales or revenue. The P/S ratio gives an idea of how much the market values every dollar of a company’s sales and can be effective in valuing unprofitable growth stocks or companies that are currently undergoing special situations or challenges. A lower the P/S ratio can be an indicator of good value.
Escalade is currently trading at a P/S of 0.75. The P/S for the Recreation industry is 2.24 and the P/S for the S&P 500 is 3.01.
How does Escalade Price-to-BookRatio (P/B) compare to the Recreation industry?
Price-to-book value (P/B) is the ratio of the market value of a company’s shares divided by its book value of equity (the value of it’s assets on the books). The book value is the difference between the book value of assets and liabilities. Typically, investors use the P/B ratio to assess if a stock is valued properly (a value of one means that the stock price is trading in line with the book value of the company). A company with a high P/B ratio could mean the stock price is overvalued as well as the converse.
Escalade P/B ratio is 1.45. The P/B for the Recreation industry is 5.35 and the P/B for the S&P 500 is 4.54.
How attractive is Escalade Return on Invested Capital (ROIC) to investors?
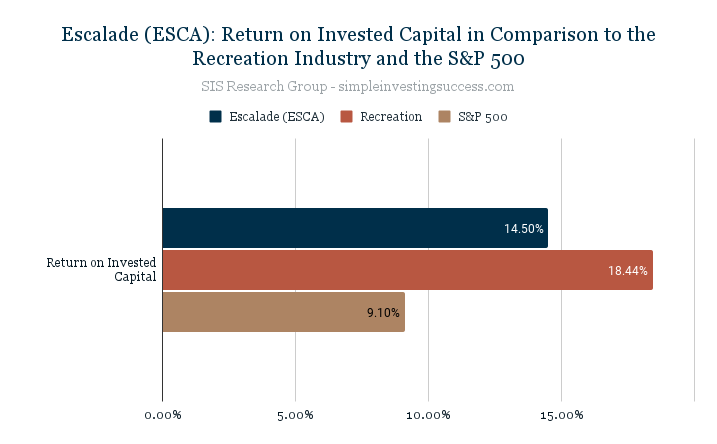
Investors use the return on invested capital (ROIC) to assess how efficient a company is at turning capital into profits. The ROIC is the amount of money a company makes on it’s investments that is above the average cost of debt and equity.
Investors can use the ROIC to provide context for metrics like the (P/E) ratio. For instance, when used in isolation a low P/E ratio could suggest a company is oversold but the decline could be because a company is no longer generating value for shareholders. Conversely, companies that consistently generate high rates of ROIC can plausibly trade at a premium compared to other stocks, even if their P/E ratios are high.
Escalade ROIC is currently 14.50% in comparison to 18.44% for the Recreation industry and 9.10% for the S&P 500.
How has ESCA stock performed over the past year? What is the current analyst price target?
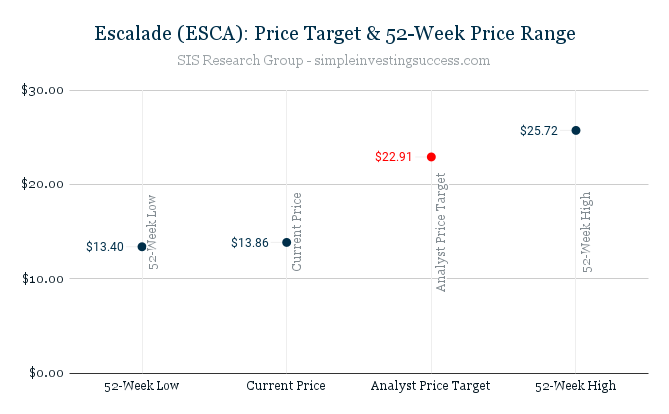
Over the past 52 weeks, Escalade has traded between the range of $13.40 and $25.72.
The current Analyst Price Target for Escalade is $22.91.
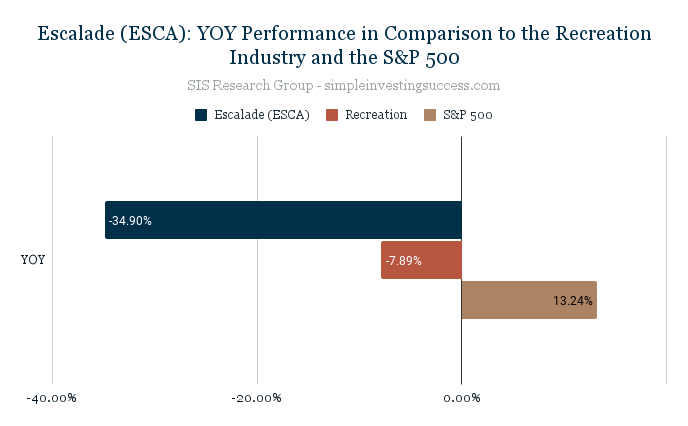
What is Escalade YOY Performance in comparison to its industry and the total market?
The YOY performance for Escalade is -34.90%. The Recreation industry has a YOY performance of -7.89% in comparison to the YOY S&P 500 performance of 13.24%.
Recent Financial Results (Q3, 2021)
- Revenue increased to $81.3M vs. $78.1M in Q3 2020 and $45.8M in Q3 2019
- Gross margin declined 760 basis points to 22.5% vs. 30.1% in Q3 2020
- Operating income of $7.7M vs. $12.8M in Q3 2020 and $2.9M in Q3 2019
- Quarterly Diluted EPS of $0.43 per share vs. $0.71 in Q3 2020 and $0.18 in Q3 2019
- Net income for the third quarter of 2021 of $6M
- Net sales of $81.3M compared to net sales of $78.1M for the same quarter in 2020, an increase of $3.2M (4.1%)
Stock Price Target: $22.91
Company Overview
Escalade manufactures and sells sporting goods in North America, Europe, and internationally. The company manufactures, imports, and distributes various sporting goods brands in basketball goals, archery, indoor and outdoor game recreation, and fitness products.
The company offers darting products under the Unicorn, Accudart, Arachnid, Nodor, and Winmau brands; water sports under the RAVE Sports brand; and outdoor game products under the Victory Tailgate, Triumph Sports, Zume Games, and Viva Sol brand names. The company provides its products through sporting goods retailers, specialty dealers, online retailers, traditional department stores, and mass merchants. Escalade was founded in 1922 and is headquartered in Evansville, Indiana. The current CEO is Scott Sincerbeaux.
Be sure to add Escalade, Inc. (ESCA) to your Watch List and if you haven’t done so already, check in on the performance of our Current Portfolio. Keep it simple and always do your due diligence.
This material is provided for informational purposes only and is not financial advice. The information contained herein should not solely be used for the formation of an investment decision, whether you are a long term or short term investor.