
DLH Holdings (DLHC) Company Overview & Stock Price Forecast
This article provides a brief analysis and stock rating for DLH Holdings (DLHC) including an updated stock price target. Additional data on the company’s earnings yield, price/earnings ratio, return on invested capital and YTD performance are discussed as well.

DLH Holdings Fundamentals
Stock Price Target: $20.35
In the section below, we discuss the earnings yield, P/E, return on invested capital and YTD performance for DLH Holdings in comparison to the Business/Consumer Services industry and the S&P 500.
DLH Holdings is a Small Cap company with a Market Cap of $185.3M.
How are investors using DLH Holdings earnings yield to assess the company?
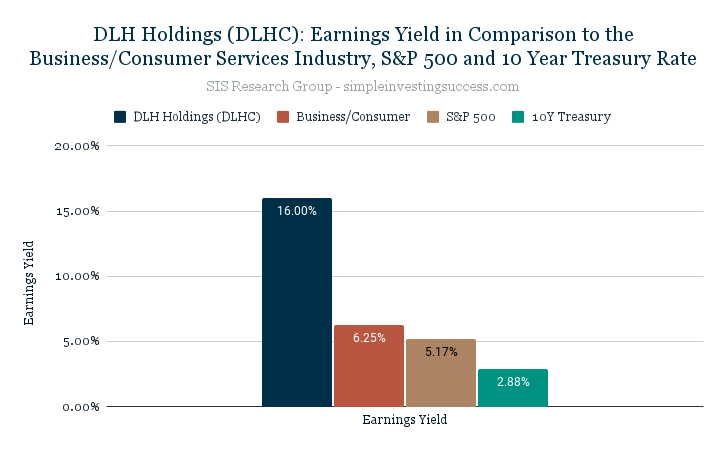
The earnings yield is used to show the percentage of a company’s earnings per share. Investors typically use earnings yield to determine which assets are underpriced or overpriced relative to other variables, like sector, industry or bond yields. Simply put, the earnings yield of a company can be used to assess how expensive a company is in relation to the earnings that are generated. When valuing companies, the SIS Research Group does not utilize the inverse P/E ratio to calculate the earnings yield. Instead, we use an adjusted earning yield calculation to capture variation amongst companies (i.e. debt and tax rates).
The current earnings yield for DLH Holdings is 16%, in comparison to 2.88% for the S&P 500 and 5.17% for the 10-year treasury bond. The median earnings yield for the Business/Consumer Services industry is 6.25%.
What does DLH Holdings Price-to-Earnings Ratio (P/E) tell investors about the company?
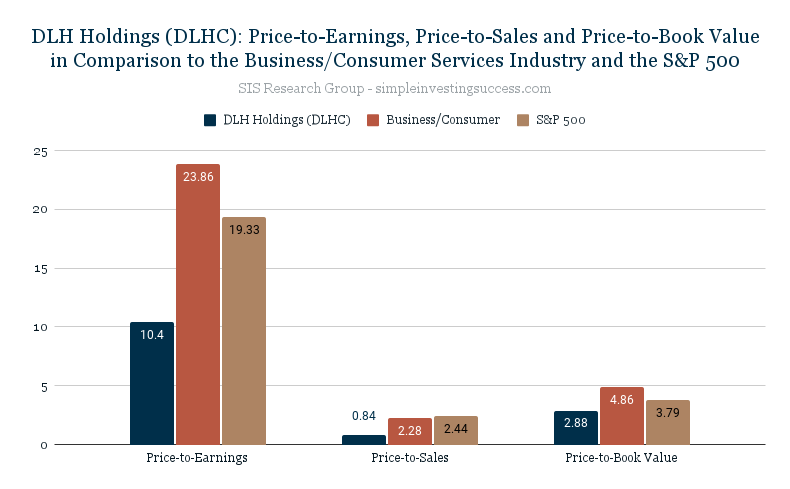
The price-to-earnings ratio (P/E) is a relatively popular metric used by investors and analysts for valuing a company’s stock. The P/E ratio can be used to show how a stock’s valuation compares to other companies and the total market. Investors use the P/E ratio to determine what the market is willing to pay today based on a company’s past or future earnings. A high P/E ratio could mean that a stock’s price is too high relative to earnings, which could be a signal that a stock is currently overvalued. In turn, a low P/E ratio could indicate that a company’s current stock price is low relative to earnings.
DLH Holdings is currently trading at a P/E of 10.40. The P/E for the Business/Consumer Services industry is 23.86 and the P/E for the S&P 500 is 19.33.
What is the current Price-to-Sales Ratio (P/S) for DLH Holdings?
The Price-to-Sales Ratio (P/S) looks at a company’s market cap and revenue to determine valuation. The P/S ratio is calculated by taking a company’s market cap and dividing by the total sales or revenue. The P/S ratio gives an idea of how much the market values every dollar of a company’s sales and can be effective in valuing unprofitable growth stocks or companies that are currently undergoing special situations or challenges. A lower the P/S ratio can be an indicator of good value.
DLH Holdings is currently trading at a P/S of 0.84. The P/S for the Business/Consumer Services industry is 2.28 and the P/S for the S&P 500 is 2.44.
How does DLH Holdings Price-to-BookRatio (P/B) compare to the Business/Consumer Services industry?
Price-to-book value (P/B) is the ratio of the market value of a company’s shares divided by its book value of equity (the value of it’s assets on the books). The book value is the difference between the book value of assets and liabilities. Typically, investors use the P/B ratio to assess if a stock is valued properly (a value of one means that the stock price is trading in line with the book value of the company). A company with a high P/B ratio could mean the stock price is overvalued as well as the converse.
DLH Holdings P/B ratio is 2.88. The P/B for the Business/Consumer Services industry is 4.86 and the P/B for the S&P 500 is 3.79.
How attractive is DLH Holdings Return on Invested Capital (ROIC) to investors?
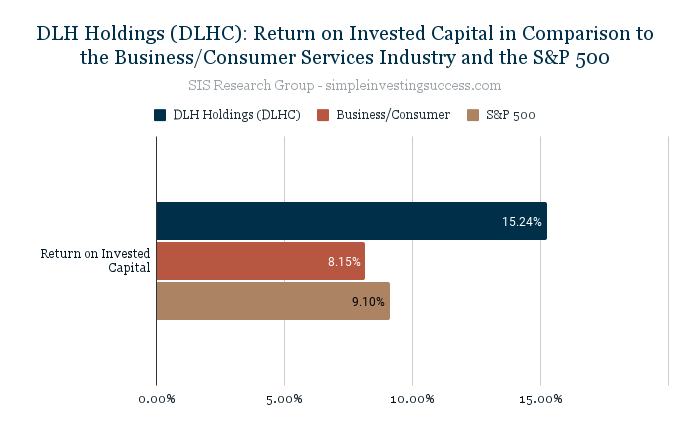
Investors use the return on invested capital (ROIC) to assess how efficient a company is at turning capital into profits. The ROIC is the amount of money a company makes on it’s investments that is above the average cost of debt and equity.
Investors can use the ROIC to provide context for metrics like the (P/E) ratio. For instance, when used in isolation a low P/E ratio could suggest a company is oversold but the decline could be because a company is no longer generating value for shareholders. Conversely, companies that consistently generate high rates of ROIC can plausibly trade at a premium compared to other stocks, even if their P/E ratios are high.
DLH Holdings ROIC is currently 15.24% in comparison to 8.15% for the Business/Consumer Services industry and 9.10% for the S&P 500.
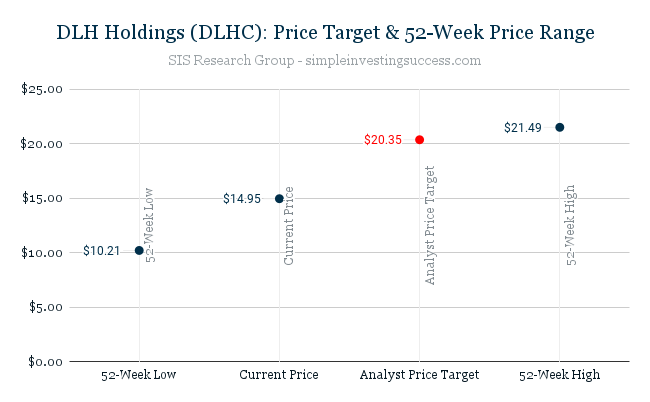
How has DLHC stock performed over the past year? What is the current analyst price target?
Over the past 52 weeks, DLH Holdings has traded between the range of $10.21 and $21.49.
The current Analyst Price Target for DLH Holdings is $20.35.
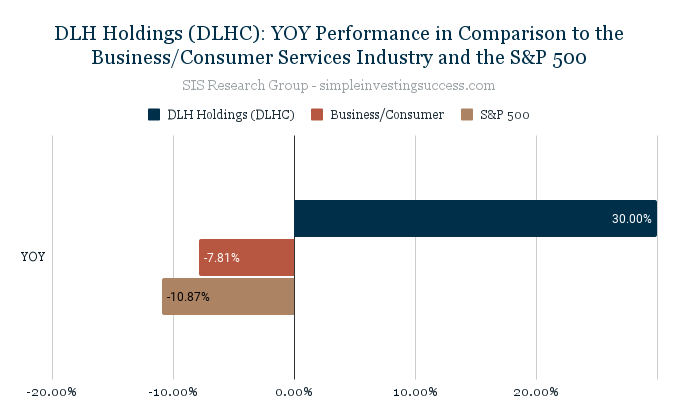
What is DLH Holdings YOY Performance in comparison to its industry and the total market?
The YOY performance for DLH Holdings is 30%. The Business/Consumer Services industry has a YOY performance of -7.81% in comparison to the YOY S&P 500 performance of -10.87%.
Recent Financial Results (Q2, 2022)
- Second quarter revenue increased to $108.7M in fiscal 2022 from $61.5M in fiscal 2021, reflecting the previously-announced award of two FEMA contracts to support Alaska, which accounted for approximately $39.8M of revenue
- Excluding these short-term contracts, second quarter revenue rose to $68.9M in fiscal 2022, an increase of 12% over the prior-year period
- Earnings were $7.2M, or $0.50 per diluted share, for the fiscal 2022 second quarter versus $2.6M, or $0.19 per diluted share, for the second quarter of fiscal 2021
- Earnings on a non-GAAP basis for the fiscal 2022 second quarter were $3.1M, or $0.22 per diluted share
- Company’s term loan reduced to $37.5M from $42.9M
- Contract backlog of $554.7M as of March 2022 versus $633.6M at the end of the first quarter, with approximately $30M of the latter related to Alaska-based task orders
Stock Price Target: $20.35
Company Overview
DLH Holdings Corp. provides technology-enabled business process outsourcing, program management solutions, and public health research and analytics services in the United States. The company offers defense and veterans’ health solutions, including healthcare, technology, and logistics solutions to the VA, Defense Health Agency, Tele-medicine and Advanced Technology Research Center, Navy Bureau of Medicine and Surgery, and the Army Medical Research and Material Command.
The company was formerly known as TeamStaff, Inc. and changed its name to DLH Holdings Corp. in June 2012. DLH Holdings Corp. was incorporated in 1969 and is headquartered in Atlanta, Georgia.
Be sure to add DLH Holdings (DHLC) to your Watch List and if you haven’t done so already, check in on the performance of our Current Portfolio. Keep it simple and always do your due diligence.
This material is provided for informational purposes only and is not financial advice. The information contained herein should not solely be used for the formation of an investment decision, whether you are a long term or short term investor.