
Coherus BioSciences (CHRS) Company Overview & Stock Price Forecast
This article provides a brief analysis and stock rating for Coherus BioSciences (CHRS) including an updated stock price target. Additional data on the company’s earnings yield, price/earnings ratio, return on invested capital and YTD performance are discussed as well.

Coherus BioSciences Fundamentals
Stock Price Target: $18.63
In the section below, we discuss the earnings yield, P/E, return on invested capital and YTD performance for Coherus BioSciences in comparison to the Biotechnology industry and the S&P 500.
Coherus BioSciences is a Small Cap company with a Market Cap of $887.6M.
How are investors using Coherus BioSciences earnings yield to assess the company?
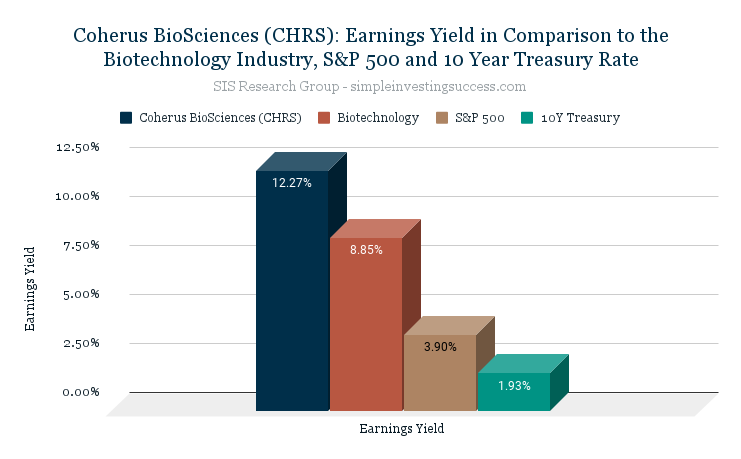
The earnings yield is used to show the percentage of a company’s earnings per share. Investors typically use earnings yield to determine which assets are underpriced or overpriced relative to other variables, like sector, industry or bond yields. Simply put, the earnings yield of a company can be used to assess how expensive a company is in relation to the earnings that are generated. When valuing companies, the SIS Research Group does not utilize the inverse P/E ratio to calculate the earnings yield. Instead, we use an adjusted earning yield calculation to capture variation amongst companies (i.e. debt and tax rates).
The current earnings yield for Coherus BioSciences is 12.27%, in comparison to 3.90% for the S&P 500 and 1.93% for the 10-year treasury bond. The median earnings yield for the Biotechnology industry is 8.85%.
What does Coherus BioSciences Price-to-Earnings Ratio (P/E) tell investors about the company?
The price-to-earnings ratio (P/E) is a relatively popular metric used by investors and analysts for valuing a company’s stock. The P/E ratio can be used to show how a stock’s valuation compares to other companies and the total market. Investors use the P/E ratio to determine what the market is willing to pay today based on a company’s past or future earnings. A high P/E ratio could mean that a stock’s price is too high relative to earnings, which could be a signal that a stock is currently overvalued. In turn, a low P/E ratio could indicate that a company’s current stock price is low relative to earnings.
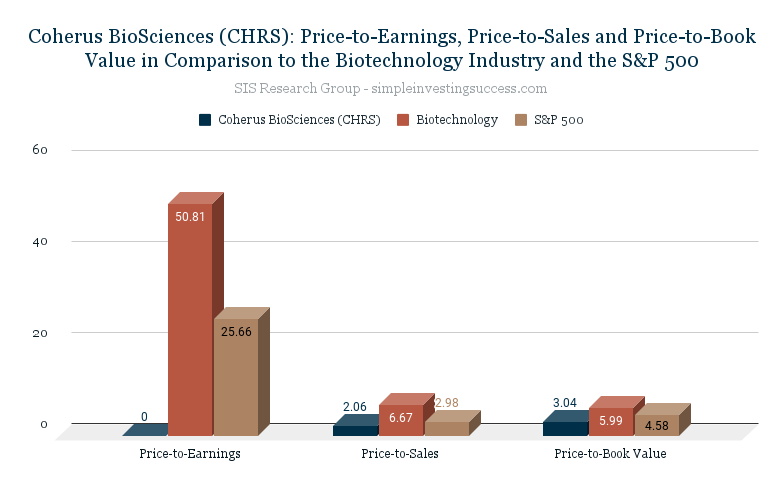
Coherus BioSciences does not currently have a reported P/E. The P/E for the Biotechnology industry is 50.81 and the P/E for the S&P 500 is 25.66.
What is the current Price-to-Sales Ratio (P/S) for Coherus BioSciences?
The Price-to-Sales Ratio (P/S) looks at a company’s market cap and revenue to determine valuation. The P/S ratio is calculated by taking a company’s market cap and dividing by the total sales or revenue. The P/S ratio gives an idea of how much the market values every dollar of a company’s sales and can be effective in valuing unprofitable growth stocks or companies that are currently undergoing special situations or challenges. A lower the P/S ratio can be an indicator of good value.
Coherus BioSciences is currently trading at a P/S of 2.06. The P/S for the Biotechnology industry is 6.67 and the P/S for the S&P 500 is 2.98.
How does Coherus BioSciences Price-to-BookRatio (P/B) compare to the Biotechnology industry?
Price-to-book value (P/B) is the ratio of the market value of a company’s shares divided by its book value of equity (the value of it’s assets on the books). The book value is the difference between the book value of assets and liabilities. Typically, investors use the P/B ratio to assess if a stock is valued properly (a value of one means that the stock price is trading in line with the book value of the company). A company with a high P/B ratio could mean the stock price is overvalued as well as the converse.
Coherus BioSciences P/B ratio is 3.04. The P/B for the Biotechnology industry is 5.99 and the P/B for the S&P 500 is 4.58.
How attractive is Coherus BioSciences Return on Invested Capital (ROIC) to investors?
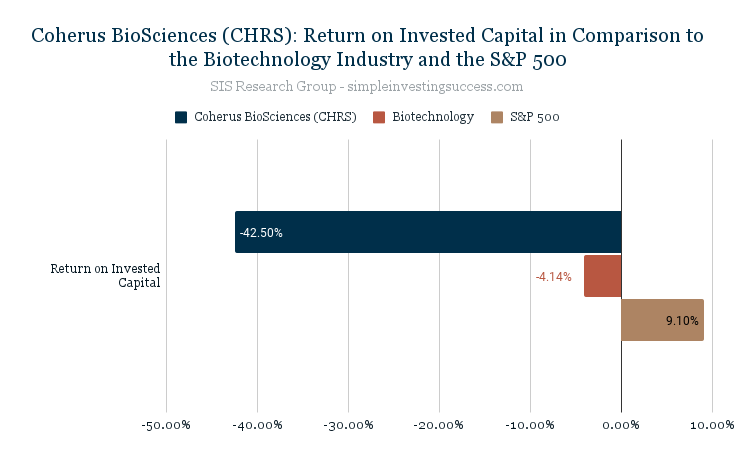
Investors use the return on invested capital (ROIC) to assess how efficient a company is at turning capital into profits. The ROIC is the amount of money a company makes on it’s investments that is above the average cost of debt and equity.
Investors can use the ROIC to provide context for metrics like the (P/E) ratio. For instance, when used in isolation a low P/E ratio could suggest a company is oversold but the decline could be because a company is no longer generating value for shareholders. Conversely, companies that consistently generate high rates of ROIC can plausibly trade at a premium compared to other stocks, even if their P/E ratios are high.
Coherus BioSciences ROIC is currently -42.50% in comparison to -4.14% for the Biotechnology industry and 9.10% for the S&P 500.
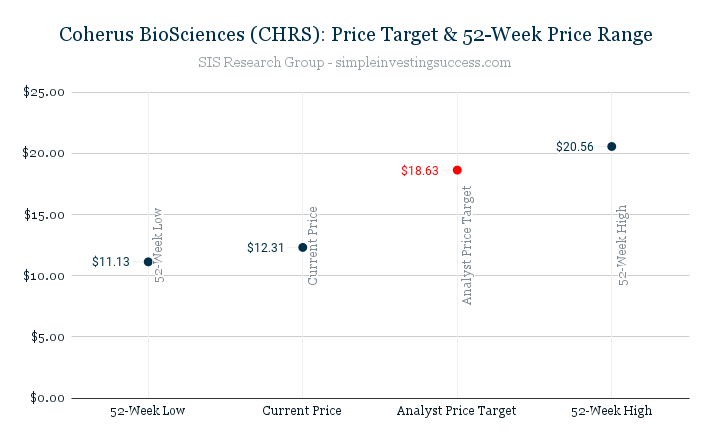
How has CHRS stock performed over the past year? What is the current analyst price target?
Over the past 52 weeks, Coherus BioSciences has traded between the range of $11.13 and $20.56.
The current Analyst Price Target for Coherus BioSciences is $18.63.
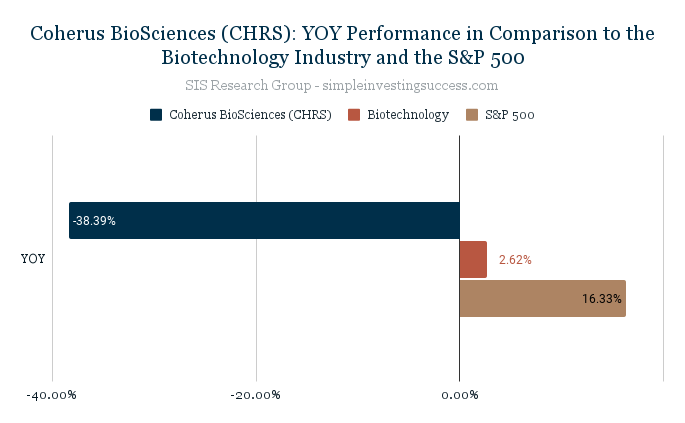
What is Coherus BioSciences YOY Performance in comparison to its industry and the total market?
The YOY performance for Coherus BioSciences is -38.39%. The Biotechnology industry has a YOY performance of 2.62% in comparison to the YOY S&P 500 performance of 16.33%.
Recent Financial Results
- Net product revenue, consisting of net sales of UDENYCA (pegfilgrastim-cbqv), was $82.5M
- GAAP net loss of $38.5M was driven by lower net product revenue and increased R&D and regulatory expenses to support the development and regulatory submissions of toripalimab and biosimilar pipeline product candidates
- Non-GAAP net loss was $26.6M, adjusting for $11.9M in stock-based compensation expense
- At September 2021, cash, cash equivalents and marketable securities were $468.7M
Stock Price Target: $18.63
Company Overview
Coherus BioSciences is a biopharmaceutical company, focuses on the biosimilar and immuno-oncology market primarily in the US. The company markets UDENYCA, a biosimilar to Neulasta, a long-acting granulocyte stimulating colony factor in the United States. Its product candidate pipeline includes biosimilars of Humira, Avastin, and Lucentis.
Coherus BioSciences has license agreements with Selexis SA; AbbVie; Pfizer; Bioeq AG; Innovent Biologics (Suzhou) Co.; and Junshi Biosciences. The company was formerly known as BioGenerics, Inc. and changed its name to Coherus BioSciences in April 2012. Coherus BioSciences was founded in 2010 and is headquartered in Redwood City, California. The current CEO is Dennis Lanfear.
Be sure to add Coherus BioSciences (CHRS) to your Watch List and if you haven’t done so already, check in on the performance of our Current Portfolio. Keep it simple and always do your due diligence.
This material is provided for informational purposes only and is not financial advice. The information contained herein should not solely be used for the formation of an investment decision, whether you are a long term or short term investor.