
ATN International (ATNI) Company Overview & Stock Price Forecast
This article provides a brief analysis and stock rating for ATN International (ATNI) including an updated stock price target. Additional data on the company’s earnings yield, price/earnings ratio, return on invested capital and YTD performance are discussed as well.

ATN International Fundamentals
Stock Price Target: $50.41
In the section below, we discuss the earnings yield, P/E, return on invested capital and YTD performance for ATN International in comparison to the Telecom Services industry and the S&P 500.
ATN International is a Small Cap company with a Market Cap of $636.9M.
How are investors using ATN International earnings yield to assess the company?
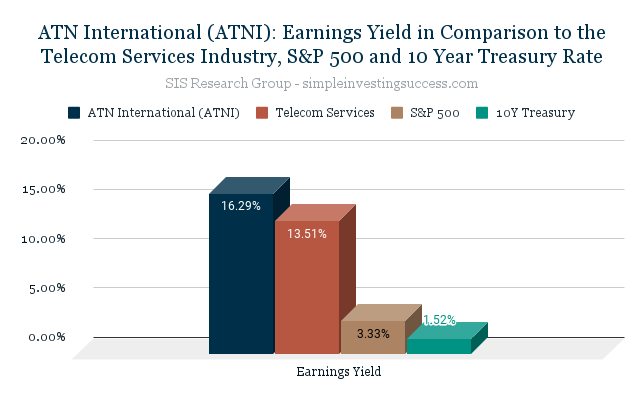
The earnings yield is used to show the percentage of a company’s earnings per share. Investors typically use earnings yield to determine which assets are underpriced or overpriced relative to other variables, like sector, industry or bond yields. Simply put, the earnings yield of a company can be used to assess how expensive a company is in relation to the earnings that are generated. When valuing companies, the SIS Research Group does not utilize the inverse P/E ratio to calculate the earnings yield. Instead, we use an adjusted earning yield calculation to capture variation amongst companies (i.e. debt and tax rates).
The current earnings yield for ATN International is 16.29%, in comparison to 3.33% for the S&P 500 and 1.52% for the 10-year treasury bond. The median earnings yield for the Telecom Services industry is 13.51%.
What does ATN International Price-to-Earnings Ratio (P/E) tell investors about the company?
The price-to-earnings ratio (P/E) is a relatively popular metric used by investors and analysts for valuing a company’s stock. The P/E ratio can be used to show how a stock’s valuation compares to other companies and the total market. Investors use the P/E ratio to determine what the market is willing to pay today based on a company’s past or future earnings. A high P/E ratio could mean that a stock’s price is too high relative to earnings, which could be a signal that a stock is currently overvalued. In turn, a low P/E ratio could indicate that a company’s current stock price is low relative to earnings.
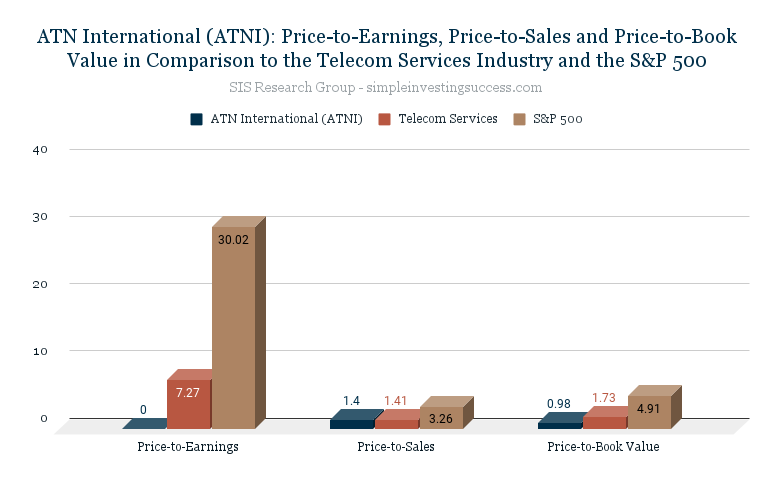
ATN International does not currently have a reported P/E. The P/E for the Telecom Services industry is 7.27 and the P/E for the S&P 500 is 30.02.
What is the current Price-to-Sales Ratio (P/S) for ATN International?
The Price-to-Sales Ratio (P/S) looks at a company’s market cap and revenue to determine valuation. The P/S ratio is calculated by taking a company’s market cap and dividing by the total sales or revenue. The P/S ratio gives an idea of how much the market values every dollar of a company’s sales and can be effective in valuing unprofitable growth stocks or companies that are currently undergoing special situations or challenges. A lower the P/S ratio can be an indicator of good value.
ATN International is currently trading at a P/S of 1.40. The P/S for the Telecom Services industry is 1.41 and the P/S for the S&P 500 is 3.26.
How does ATN International Price-to-BookRatio (P/B) compare to the Telecom Services industry?
Price-to-book value (P/B) is the ratio of the market value of a company’s shares divided by its book value of equity (the value of it’s assets on the books). The book value is the difference between the book value of assets and liabilities. Typically, investors use the P/B ratio to assess if a stock is valued properly (a value of one means that the stock price is trading in line with the book value of the company). A company with a high P/B ratio could mean the stock price is overvalued as well as the converse.
ATN International P/B ratio is 0.98. The P/B for the Telecom Services industry is 1.73 and the P/B for the S&P 500 is 4.91.
How attractive is ATN International Return on Invested Capital (ROIC) to investors?
Investors use the return on invested capital (ROIC) to assess how efficient a company is at turning capital into profits. The ROIC is the amount of money a company makes on it’s investments that is above the average cost of debt and equity.
Investors can use the ROIC to provide context for metrics like the (P/E) ratio. For instance, when used in isolation a low P/E ratio could suggest a company is oversold but the decline could be because a company is no longer generating value for shareholders. Conversely, companies that consistently generate high rates of ROIC can plausibly trade at a premium compared to other stocks, even if their P/E ratios are high.
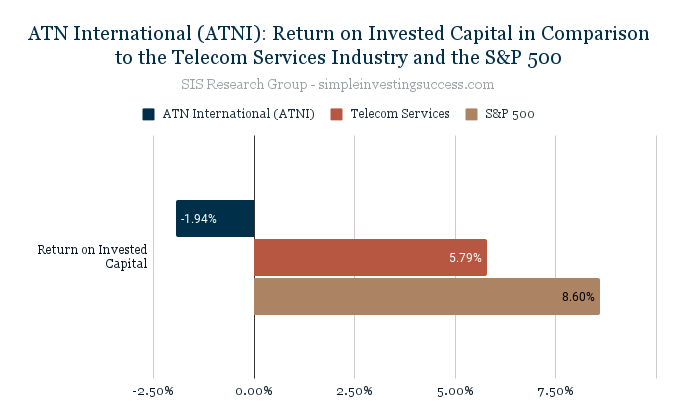
ATN International ROIC is currently -1.94% in comparison to 5.79% for the Telecom Services industry and 8.60% for the S&P 500.
How has ATNI stock performed over the past year? What is the current analyst price target?
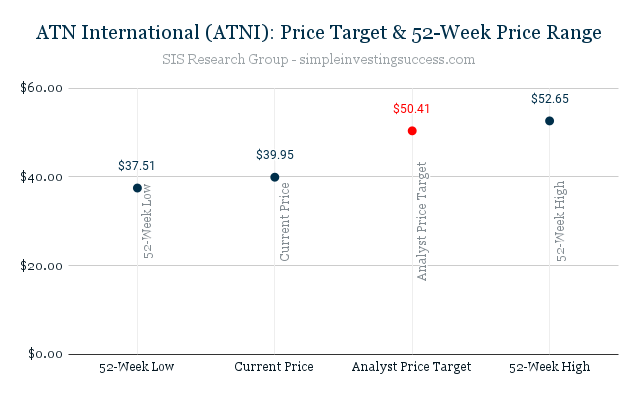
Over the past 52 weeks, ATN International has traded between the range of $37.51 and $52.65.
The current Analyst Price Target for ATN International is $50.41.
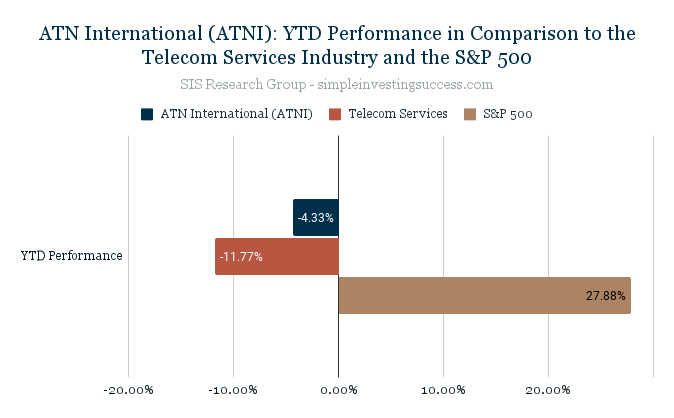
What is ATN International YTD Performance in comparison to its industry and the total market?
The year-to-date (YTD) performance is the amount of profit/loss realized by a stock since the first trading day of the current calendar year.
The YTD performance for ATN International is -4.33%. The Telecom Services industry has a YTD performance of -11.77% in comparison to the YTD S&P 500 performance of 27.88%.
Recent Financial Results
- Q3 2021 revenues of $166.8M, up 49% compared to the prior year quarter’s revenue of $111.7M
- Closed the acquisition of Alaska Communications in late July 2021, which contributed $46.8M to third quarter revenues
- Operating loss of $1M and Adjusted EBITDA of $36.8M, compared with the prior year quarter’s operating income of $9.6M and Adjusted EBITDA of $31.2M
- Net loss attributable to ATN’s stockholders of $2.6M, and a $0.22 loss per share, compared with the prior year period’s net income attributable to ATN’s stockholders of $2.7M, or $0.17 income per diluted share
Stock Price Target: $50.41
Company Overview
ATN International provides telecommunications services in the US, the Caribbean and Bermuda. It operates in three segments: International Telecom, US Telecom, and Renewable Energy. The International Telecom segment provides fixed data, internet, voice, and retail mobility services to customers in Bermuda, the Cayman Islands, Guyana, and the US Virgin Islands.
The Renewable Energy segment provides distributed generation solar power to commercial and industrial customers in Massachusetts, California, and New Jersey. As of December 2020, it operated fourteen retail stores in US Telecom segment and twenty two retail stores in International Telecom segment. The company was formerly known as Atlantic Tele-Network, Inc. and changed its name to ATN International, Inc. in June 2016. ATN International was incorporated in 1987 and is headquartered in Beverly, Massachusetts. The current CEO is Michael T. Prior.
Be sure to add ATN International (ATNI) to your Watch List and if you haven’t done so already, check in on the performance of our Current Portfolio. Keep it simple and always do your due diligence.
This material is provided for informational purposes only and is not financial advice. The information contained herein should not solely be used for the formation of an investment decision, whether you are a long term or short term investor.