
Alpha Pro Tech (APT) Company Overview & Stock Price Forecast
This article provides a brief analysis and stock rating for Alpha Pro Tech (APT) including an updated stock price target. Additional data on the company’s earnings yield, price/earnings ratio, return on invested capital and YTD performance are discussed as well.

Alpha Pro Tech Fundamentals
Stock Price Target: $16.57
In the section below, we discuss the earnings yield, P/E, return on invested capital and YTD performance for Alpha Pro Tech in comparison to the Building Materials industry and the S&P 500.
Alpha Pro Tech is a Micro Cap company with a Market Cap of $68.5M.
How are investors using Alpha Pro Tech earnings yield to assess the company?
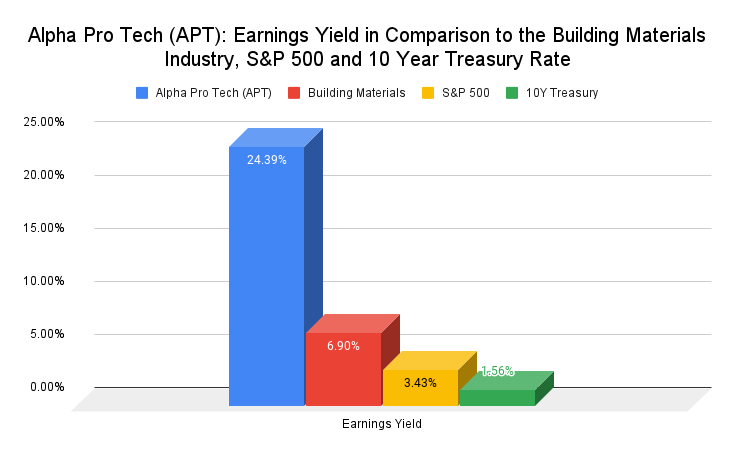
The earnings yield is used to show the percentage of a company’s earnings per share. Investors typically use earnings yield to determine which assets are underpriced or overpriced relative to other variables, like sector, industry or bond yields. Simply put, the earnings yield of a company can be used to assess how expensive a company is in relation to the earnings that are generated. When valuing companies, the SIS Research Group does not utilize the inverse P/E ratio to calculate the earnings yield. Instead, we use an adjusted earning yield calculation to capture variation amongst companies (i.e. debt and tax rates).
The current earnings yield for Alpha Pro Tech is 24.39%, in comparison to 3.43% for the S&P 500 and 1.56% for the 10-year treasury bond. The median earnings yield for the Building Materials industry is 6.90%.
What does Alpha Pro Tech Price-to-Earnings Ratio (P/E) tell investors about the company?
The price-to-earnings ratio (P/E) is a relatively popular metric used by investors and analysts for valuing a company’s stock. The P/E ratio can be used to show how a stock’s valuation compares to other companies and the total market. Investors use the P/E ratio to determine what the market is willing to pay today based on a company’s past or future earnings. A high P/E ratio could mean that a stock’s price is too high relative to earnings, which could be a signal that a stock is currently overvalued. In turn, a low P/E ratio could indicate that a company’s current stock price is low relative to earnings.
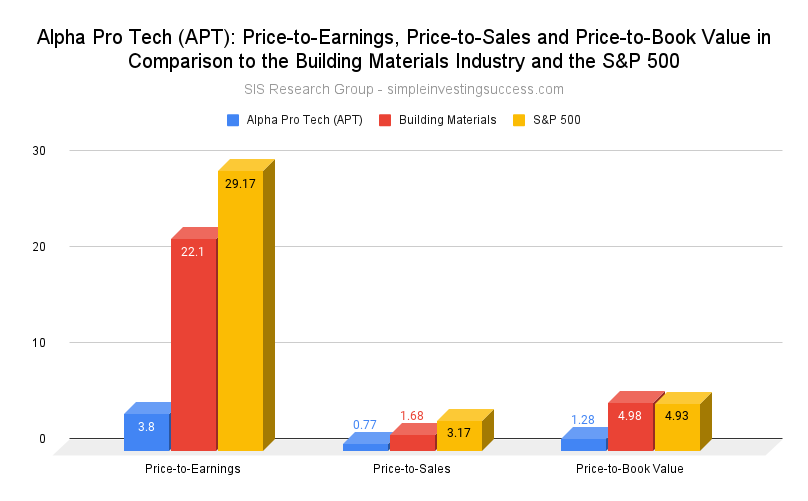
Alpha Pro Tech is currently trading at a P/E of 3.80. The P/E for the Building Materials industry is 22.10 and the P/E for the S&P 500 is 29.17.
What is the current Price-to-Sales Ratio (P/S) for Alpha Pro Tech?
The Price-to-Sales Ratio (P/S) looks at a company’s market cap and revenue to determine valuation. The P/S ratio is calculated by taking a company’s market cap and dividing by the total sales or revenue. The P/S ratio gives an idea of how much the market values every dollar of a company’s sales and can be effective in valuing unprofitable growth stocks or companies that are currently undergoing special situations or challenges. A lower the P/S ratio can be an indicator of good value.
Alpha Pro Tech is currently trading at a P/S of 0.77. The P/S for the Building Materials industry is 1.68 and the P/S for the S&P 500 is 3.17.
How does Alpha Pro Tech Price-to-Book Ratio (P/B) compare to the Building Materials industry?
Price-to-book value (P/B) is the ratio of the market value of a company’s shares divided by its book value of equity (the value of it’s assets on the books). The book value is the difference between the book value of assets and liabilities. Typically, investors use the P/B ratio to assess if a stock is valued properly (a value of one means that the stock price is trading in line with the book value of the company). A company with a high P/B ratio could mean the stock price is overvalued as well as the converse.
Alpha Pro Tech P/B ratio is 1.28. The P/B for the Building Materials industry is 4.98 and the P/B for the S&P 500 is 4.93.
How attractive is Alpha Pro Tech Return on Invested Capital (ROIC) to investors?
Investors use the return on invested capital (ROIC) to assess how efficient a company is at turning capital into profits. The ROIC is the amount of money a company makes on it’s investments that is above the average cost of debt and equity.
Investors can use the ROIC to provide context for metrics like the (P/E) ratio. For instance, when used in isolation a low P/E ratio could suggest a company is oversold but the decline could be because a company is no longer generating value for shareholders. Conversely, companies that consistently generate high rates of ROIC can plausibly trade at a premium compared to other stocks, even if their P/E ratios are high.
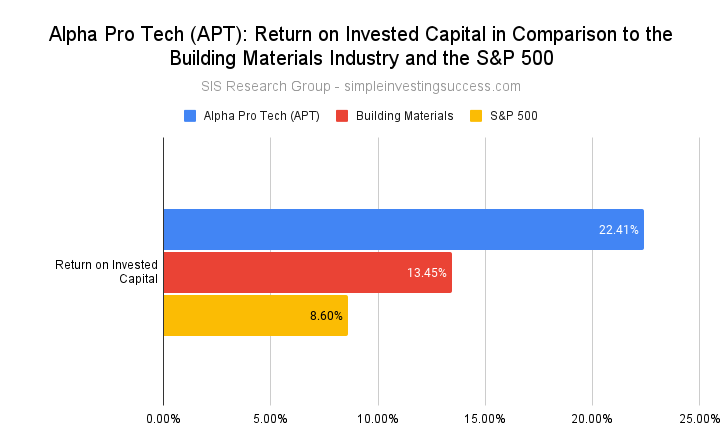
Alpha Pro Tech ROIC is currently -9.50% in comparison to 13.45% for the Building Materials industry and 8.60% for the S&P 500.
What is Alpha Pro Tech YTD Performance in comparison to its industry and the total market?
The year-to-date (YTD) performance is the amount of profit/loss realized by a stock since the first trading day of the current calendar year.
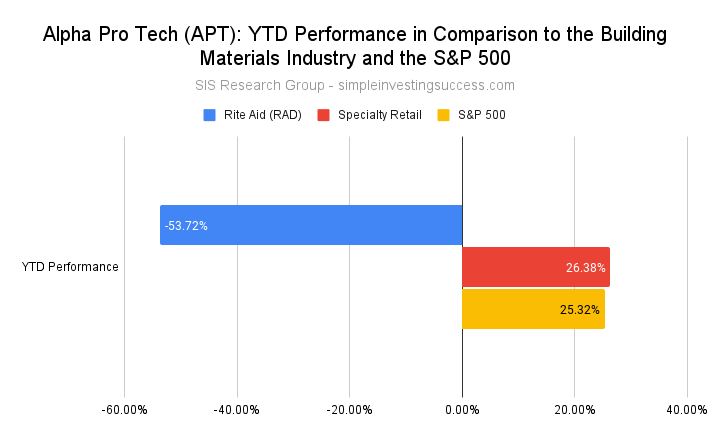
The YTD performance for Alpha Pro Tech is -53.72%. The Building Materials industry has a YTD performance of 26.38% in comparison to the YTD S&P 500 performance of 25.32%.
Recent Financial Results
- Net sales for Q3 2021 of $14.5M, a decrease of 51.8%, compared to $30M in previous year quarter
- Building Supply segment sales increased by $2.4M to $10.1M, compared to $7.7M in previous year quarter
- Disposable Protective Apparel segment sales decreased by 80.3%, to $4.4M compared to $22.4M for the same period of 2020
- Net income of Q3 2021 of $766,000, compared to $8.1M
- Cash of $17.6M and working capital of $49.7M with no debt as of September 2021
Stock Price Target: $16.57
Company Overview
Alpha Pro Tech develops, manufactures, and markets a range of disposable protective apparel, infection control, and building supply products in the US and internationally. The company operates through two segments: Disposable Protective Apparel and Building Supply.
The Disposable Protective Apparel segment provides lab coats, gowns, hoods, as well as face masks and shields. The Building Supply segment offers construction weatherization products, such as housewrap, synthetic roof underlayment, and other woven materials. The company markets its products under the Alpha Pro Tech brand name, as well as under private labels.
Alpha Pro Tech’s products are used primarily in cleanrooms, industrial safety manufacturing environments, health care facilities, building and re-roofing sites and pharmaceutical markets. The company distributes its products through a network of purchasing groups, distributors and its sales and marketing force.
Alpha Pro Tech was founded in 1983 and is headquartered in Markham, Canada. The current CEO is Lloyd Hoffman.
Be sure to add Alpha Pro Tech (APT) to your Watch List and if you haven’t done so already, check in on the performance of our Current Portfolio. Keep it simple and always do your due diligence.
This material is provided for informational purposes only and is not financial advice. The information contained herein should not solely be used for the formation of an investment decision, whether you are a long term or short term investor.